Lenovo 2011 Annual Report Download - page 36
Download and view the complete annual report
Please find page 36 of the 2011 Lenovo annual report below. You can navigate through the pages in the report by either clicking on the pages listed below, or by using the keyword search tool below to find specific information within the annual report.-
 1
1 -
2
-
3
-
4
-
5
-
6
-
7
-
8
-
9
-
10
-
11
-
12
-
13
-
14
-
15
-
16
-
17
-
18
-
19
-
20
-
21
-
22
-
23
-
24
-
25
-
 26
26 -
 27
27 -
 28
28 -
 29
29 -
 30
30 -
 31
31 -
 32
32 -
 33
33 -
 34
34 -
 35
35 -
 36
36 -
 37
37 -
 38
38 -
 39
39 -
 40
40 -
 41
41 -
 42
42 -
 43
43 -
 44
44 -
 45
45 -
 46
46 -
47
-
48
-
49
-
50
-
51
-
52
-
53
-
54
-
55
-
56
-
57
-
58
-
59
-
60
-
61
-
62
-
63
-
64
-
65
-
66
-
67
-
68
-
69
-
70
-
71
-
72
-
73
-
74
-
75
-
76
-
77
-
78
-
79
-
80
-
81
-
82
-
83
-
84
-
85
-
86
-
87
-
88
-
89
-
90
-
91
-
92
-
93
-
94
-
95
-
96
-
97
-
98
-
99
-
100
-
101
-
102
-
103
-
104
-
105
-
106
-
107
-
108
-
109
-
110
-
111
-
112
-
113
-
114
-
115
-
116
-
117
-
118
-
119
-
120
-
121
-
122
-
123
-
124
-
125
-
126
-
127
-
128
-
129
-
130
-
131
-
132
-
133
-
134
-
135
-
136
-
137
 |
 |

2010/11 Annual Report Lenovo Group Limited 39
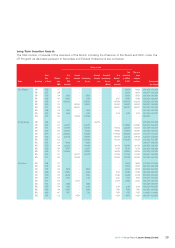
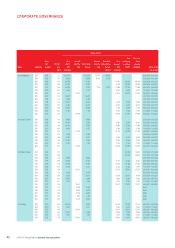
Long-Term Incentive Awards
The total number of awards of the members of the Board, including the Chairman of the Board and CEO, under the
LTI Program as disclosed pursuant to Securities and Futures Ordinance is set out below:
Number of units
Name Award type
Fiscal
Year
of Award
Effective
price
As at
April 1,
2010
Awarded
during the
year
Vested during
the year
Exercised
during the
year
Cancelled/
lapsed during
the year
As at
March 31,
2011
Total
outstanding
as at March
31, 2011
Max no. of
shares
subject to
conditions Vesting period
(HK$) (unvested) (Note 3) (unvested) (mm.dd.yyyy)
Mr. Liu Chuanzhi SAR 05/06 3.15 – – – – – – 564,000 564,000 05.01.2006 – 05.01.2008
SAR 06/07 2.99 – – – – – – 390,000 390,000 06.01.2007 – 06.01.2009
SAR 07/08 3.94 99,000 –99,000 – – – 297,000 297,000 06.01.2008 – 06.01.2010
SAR 08/09 5.88 130,653 –65,326 – – 65,327 195,980 195,980 06.01.2009 – 06.01.2011
SAR 09/10 3.17 18,500,000 –4,625,000 – – 13,875,000 18,500,000 18,500,000 05.25.2010 – 05.25-2013
SAR 09/10 5.23 –5,930,042 1,976,681 – – 5,953,361 5,930,042 5,930,042 02.08.2011 – 02.08.2013
SAR 10/11 4.92 –6,644,127 – – – 6,644,127 6,644,127 6,644,127 02.21.2012 – 02.21.2014
RSU 07/08 3.94 33,000 –33,000 – – – – – 06.01.2008 – 06.01.2010
RSU 08/09 5.88 52,260 –26,130 – – 26,130 26,130 26,130 06.01.2009 – 06.01.2011
RSU 10/11 3.95 –1,545,892 1,545,892 – – – – – 06.18.2010
Mr. Yang Yuanqing SAR 05/06 2.42 – – – 6,362,756 – – – – 05.01.2006 – 05.01.2009
SAR 06/07 2.35 3,346,417 –3,346,417 – – – 13,385,665 13,385,665 06.01.2007 – 06.01.2010
SAR 07/08 3.94 3,001,005 –1,500,503 – – 1,500,502 6,002,009 6,002,009 06.01.2008 – 06.01.2011
SAR 08/09 5.88 2,954,891 –984,964 – – 1,969,927 3,939,855 3,939,855 06.01.2009 – 06.01.2012
SAR 09/10 3.17 22,800,000 –5,700,000 – – 17,100,000 22,800,000 22,800,000 05.25,2010 – 05.25,2013
SAR 09/10 5.23 6,596,156 –1,649,039 – – 4,947,117 6,596,156 6,596,156 02.08.2011 – 02.08.2014
SAR 10/11 4.92 – – 11,030,219 – – 11,030,219 11,030,219 11,030,219 02.21.2012 – 02.21.2015
RSU 06/07 2.35 743,649 –743,649 – – – – – 06.01.2007 – 06.01.2010
RSU 07/08 3.94 3,362,202 –1,681,102 – – 1,681,100 1,681,100 1,681,100 06.01.2008 – 06.01.2011
RSU 08/09 5.88 787,971 –262,657 – – 525,314 525,314 525,314 06.01.2009 – 06.01.2012
RSU 09/10 3.17 10,200,000 –2,550,000 – – 7,650,000 7,650,000 7,650,000 05.25.2010 – 05.25.2013
RSU 09/10 5.23 –4,947,117 1,236,779 – – 3,710,338 3,710,338 3,710,338 02.08.2011 – 02.08.2014
RSU 10/11 4.92 –7,878,728 – – – 7,878,728 7,878,728 7,878,728 02.21.2012 – 02.21.2015
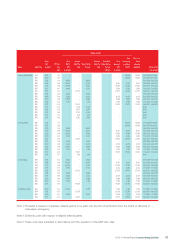
Mr. Zhu Linan SAR 05/06 3.15 – – – – – – 564,000 564,000 05.01.2006 – 05.01.2008
SAR 06/07 2.99 – – – – – – 390,000 390,000 06.01.2007 – 06.01.2009
SAR 07/08 3.94 99,000 –99,000 –––297,000 297,000 06.01.2008 – 06.01.2010
SAR 08/09 5.88 130,653 –65,326 – – 65,327 195,980 195,980 06.01.2009 – 06.01.2011
SAR 09/10 3.88 263,796 –87,932 – – 175,864 263,796 263,796 08.07.2010 – 08.07.2012
SAR 09/10 4.47 38,163 –12,721 – – 25,442 38,163 38,163 11.30.2010 – 11.30.2012
SAR 10/11 4.59 –237,001 – – – 237,001 237,001 237,001 08.20.2011 – 08.20.2013
RSU 07/08 3.94 33,000 –33,000 – – – – – 06.01.2008 – 06.01.2010
RSU 08/09 5.88 52,260 –26,130 – – 26,130 26,130 26,130 06.01.2009 – 06.01.2011
RSU 09/10 3.88 119,907 –39,969 – – 79,938 79,938 79,938 08.07.2010 – 08.07.2012
RSU 09/10 4.47 17,347 –5,782 – – 11,565 11,565 11,565 11.30.2010 – 11.30.2012
RSU 10/11 4.59 –118,501 – – – 118,501 118,501 118,501 08.20.2011 – 08.20.2013