Lenovo 2011 Annual Report Download - page 112
Download and view the complete annual report
Please find page 112 of the 2011 Lenovo annual report below. You can navigate through the pages in the report by either clicking on the pages listed below, or by using the keyword search tool below to find specific information within the annual report.-
 1
1 -
2
-
3
-
4
-
5
-
6
-
7
-
8
-
9
-
10
-
11
-
12
-
13
-
14
-
15
-
16
-
17
-
18
-
19
-
20
-
21
-
22
-
23
-
24
-
25
-
26
-
27
-
28
-
29
-
30
-
31
-
32
-
33
-
34
-
35
-
36
-
37
-
38
-
39
-
40
-
41
-
42
-
43
-
44
-
45
-
46
-
47
-
48
-
49
-
50
-
51
-
52
-
53
-
54
-
55
-
56
-
57
-
58
-
59
-
60
-
61
-
62
-
63
-
64
-
65
-
66
-
67
-
68
-
69
-
70
-
71
-
72
-
73
-
74
-
75
-
76
-
77
-
78
-
79
-
80
-
81
-
82
-
83
-
84
-
85
-
86
-
87
-
88
-
89
-
90
-
91
-
92
-
93
-
94
-
95
-
96
-
97
-
98
-
99
-
100
-
101
-
 102
102 -
 103
103 -
 104
104 -
 105
105 -
 106
106 -
 107
107 -
 108
108 -
 109
109 -
 110
110 -
 111
111 -
 112
112 -
 113
113 -
 114
114 -
 115
115 -
 116
116 -
 117
117 -
 118
118 -
 119
119 -
 120
120 -
 121
121 -
 122
122 -
123
-
124
-
125
-
126
-
127
-
128
-
129
-
130
-
131
-
132
-
133
-
134
-
135
-
136
-
137
 |
 |

2010/11 Annual Report Lenovo Group Limited 115
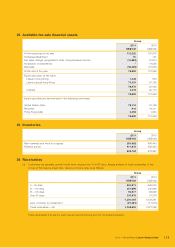
22 Available-for-sale financial assets
Group
2011 2010
US$’000 US$’000
At the beginning of the year 112,520 101,916
Exchange adjustment 81 191
Fair value change recognized in other comprehensive income (15,892) 67,674
Acquisition of subsidiaries –18,020
Disposals (18,020) (75,281)
At the end of the year 78,689 112,520
Equity securities, at fair value
Listed in Hong Kong 1,442 636
Listed outside Hong Kong 75,031 91,769
76,473 92,405
Unlisted 2,216 20,115
78,689 112,520
Equity securities are denominated in the following currencies:
United States dollar 75,119 91,769
Renminbi 914 19,111
Hong Kong dollar 2,656 1,640
78,689 112,520
23 Inventories
Group
2011 2010
US$’000 US$’000
Raw materials and work-in-progress 391,892 490,443
Finished goods 411,810 388,444
803,702 878,887
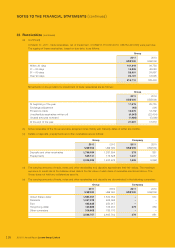
24 Receivables
(a) Customers are generally granted credit term ranging from 15 to 60 days. Ageing analysis of trade receivables of the
Group at the balance sheet date, based on invoice date, is as follows:
Group
2011 2010
US$’000 US$’000
0 – 30 days 941,811 665,535
31 – 60 days 251,698 242,946
61 – 90 days 92,817 68,526
Over 90 days 103,679 61,374
1,390,005 1,038,381
Less: provision for impairment (21,081) (17,319)
Trade receivables – net 1,368,924 1,021,062
Trade receivables that are not past due are fully performing and not considered impaired.