Lenovo 2011 Annual Report Download - page 104
Download and view the complete annual report
Please find page 104 of the 2011 Lenovo annual report below. You can navigate through the pages in the report by either clicking on the pages listed below, or by using the keyword search tool below to find specific information within the annual report.-
 1
1 -
2
-
3
-
4
-
5
-
6
-
7
-
8
-
9
-
10
-
11
-
12
-
13
-
14
-
15
-
16
-
17
-
18
-
19
-
20
-
21
-
22
-
23
-
24
-
25
-
26
-
27
-
28
-
29
-
30
-
31
-
32
-
33
-
34
-
35
-
36
-
37
-
38
-
39
-
40
-
41
-
42
-
43
-
44
-
45
-
46
-
47
-
48
-
49
-
50
-
51
-
52
-
53
-
54
-
55
-
56
-
57
-
58
-
59
-
60
-
61
-
62
-
63
-
64
-
65
-
66
-
67
-
68
-
69
-
70
-
71
-
72
-
73
-
74
-
75
-
76
-
77
-
78
-
79
-
80
-
81
-
82
-
83
-
84
-
85
-
86
-
87
-
88
-
89
-
90
-
91
-
92
-
93
-
 94
94 -
 95
95 -
 96
96 -
 97
97 -
 98
98 -
 99
99 -
 100
100 -
 101
101 -
 102
102 -
 103
103 -
 104
104 -
 105
105 -
 106
106 -
 107
107 -
 108
108 -
 109
109 -
 110
110 -
 111
111 -
 112
112 -
 113
113 -
 114
114 -
115
-
116
-
117
-
118
-
119
-
120
-
121
-
122
-
123
-
124
-
125
-
126
-
127
-
128
-
129
-
130
-
131
-
132
-
133
-
134
-
135
-
136
-
137
 |
 |

2010/11 Annual Report Lenovo Group Limited 107
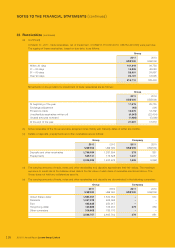
15 Prepaid lease payments
Group
2011 2010
US$’000 US$’000
At the beginning of the year 3,748 5,833
Exchange adjustment 164 8
Disposal of subsidiaries –(1,660)
Transfer from property, plant and equipment 5,866 –
Disposals –(308)
Amortization (96) (125)
At the end of the year 9,682 3,748
Prepaid lease payments represent the payments for land use rights held by the Group in the Chinese Mainland under medium
leases (less than 50 years but not less than 10 years).
16 Construction-in-progress
Group Company
Buildings under
construction Internal use software Others Total Internal use software
2011 2010 2011 2010 2011 2010 2011 2010 2011 2010
US$’000 US$’000 US$’000 US$’000 US$’000 US$’000 US$’000 US$’000 US$’000 US$’000
At the beginning of the year 414 2,158 23,772 44,156 525 748 24,711 47,062 2,204 7,780
Exchange adjustment 31 2315 5(1) 1345 8(9) (6)
Reclassification (354) (1,253) (17) 246 255 1,007 (116) –––
Additions 1,335 196 66,752 37,125 10,444 2,658 78,531 39,979 4,868 2,206
Acquisition of subsidiaries –––145 –––145 ––
Transfer to property,
plant and equipment (688) (611) –(658) (2,135) (3,889) (2,823) (5,158) ––
Transfer to intangible assets ––(66,821) (56,499) (320) –(67,141) (56,499) (3,461) (7,776)
Disposals –––(748) (1,415) –(1,415) (748) ––
Disposals of subsidiaries –(78) –––––(78) ––
At the end of the year 738 414 24,001 23,772 7,353 525 32,092 24,711 3,602 2,204
No interest expenses were capitalized in construction-in-progress as at March 31, 2011 and 2010.