Kodak 2012 Annual Report Download - page 99
Download and view the complete annual report
Please find page 99 of the 2012 Kodak annual report below. You can navigate through the pages in the report by either clicking on the pages listed below, or by using the keyword search tool below to find specific information within the annual report.-
 1
1 -
2
-
3
-
4
-
5
-
6
-
7
-
8
-
9
-
10
-
11
-
12
-
13
-
14
-
15
-
16
-
17
-
18
-
19
-
20
-
21
-
22
-
23
-
24
-
25
-
26
-
27
-
28
-
29
-
30
-
31
-
32
-
33
-
34
-
35
-
36
-
37
-
38
-
39
-
40
-
41
-
42
-
43
-
44
-
45
-
46
-
47
-
48
-
49
-
50
-
51
-
52
-
53
-
54
-
55
-
56
-
57
-
58
-
59
-
60
-
61
-
62
-
63
-
64
-
65
-
66
-
67
-
68
-
69
-
70
-
71
-
72
-
73
-
74
-
75
-
76
-
77
-
78
-
79
-
80
-
81
-
82
-
83
-
84
-
85
-
86
-
87
-
88
-
 89
89 -
 90
90 -
 91
91 -
 92
92 -
 93
93 -
 94
94 -
 95
95 -
 96
96 -
 97
97 -
 98
98 -
 99
99 -
 100
100 -
 101
101 -
 102
102 -
 103
103 -
 104
104 -
 105
105 -
 106
106 -
 107
107 -
 108
108 -
 109
109 -
110
-
111
-
112
-
113
-
114
-
115
-
116
-
117
-
118
-
119
-
120
-
121
-
122
-
123
-
124
-
125
-
126
-
127
-
128
-
129
-
130
-
131
-
132
-
133
-
134
-
135
-
136
-
137
-
138
-
139
-
140
-
141
-
142
-
143
-
144
-
145
-
146
-
147
-
148
-
149
-
150
-
151
-
152
-
153
-
154
-
155
-
156
-
157
-
158
-
159
-
160
-
161
-
162
-
163
-
164
-
165
-
166
-
167
-
168
-
169
-
170
-
171
-
172
-
173
-
174
-
175
-
176
-
177
-
178
-
179
-
180
-
181
-
182
-
183
-
184
-
185
-
186
-
187
-
188
-
189
-
190
-
191
-
192
-
193
-
194
-
195
-
196
-
197
-
198
-
199
-
200
-
201
-
202
 |
 |

Table of Contents
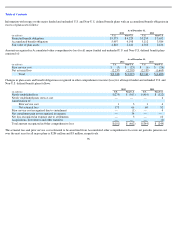
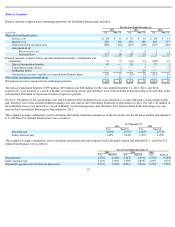
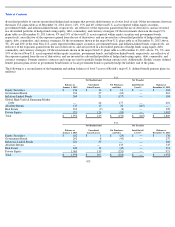
Information regarding the major funded and unfunded U.S. and Non-U.S. defined benefit plans follows:
Amounts recognized in the Consolidated Statement of Financial Position for all major funded and unfunded U.S. and Non-U.S. defined benefit
plans were as follows:
95
2012
2011
(in millions)
U.S.
Non
-
U.S.
U.S.
Non
-
U.S.
Change in Benefit Obligation
Projected benefit obligation at January 1
$
5,259
$
3,652
$
5,071
$
3,636
Acquisitions/divestitures/other transfers
—
—
(
1
)
2
Service cost
48
10
50
16
Interest cost
206
156
254
180
Participant contributions
—
2
—
4
Plan amendments
—
—
—
(
4
)
Benefit payments
(422
)
(226
)
(535
)
(226
)
Actuarial loss
385
560
392
160
Curtailments
—
(
34
)
—
—
Settlements
—
(
8
)
—
(
86
)
Special termination benefits
99
—
28
1
Currency adjustments
—
152
—
(
31
)
Projected benefit obligation at December 31
$
5,575
$
4,264
$
5,259
$
3,652
Change in Plan Assets
Fair value of plan assets at January 1
$
4,763
$
2,436
$
4,861
$
2,634
Acquisitions/divestitures
—
—
—
1
Actual gain on plan assets
500
157
412
47
Employer contributions
7
29
25
78
Participant contributions
—
2
—
4
Settlements
—
(
8
)
—
(
86
)
Benefit payments
(422
)
(226
)
(535
)
(226
)
Currency adjustments
—
89
—
(
16
)
Fair value of plan assets at January 1
$
4,848
$
2,479
$
4,763
$
2,436
Under Funded Status at December 31
$
(727
)
$
(1,785
)
$
(496
)
$
(1,216
)
Accumulated benefit obligation at December 31
$
5,497
$
4,233
$
5,112
$
3,584
As of December 31,
2012
2011
(in millions)
U.S.
Non
-
U.S.
U.S.
Non
-
U.S.
Other long
-
term assests
$
—
$
2
$
—
$
—
Other current liabilities
—
—
(
18
)
—
Pension and other postretirement liabilities
—
(
1,787
)
(478
)
(1,216
)
Liabilities subject to compromise
(727
)
—
—
—
Net amount recognized
$
(727
)
$
(1,785
)
$
(496
)
$
(1,216
)