Kodak 2012 Annual Report Download - page 51
Download and view the complete annual report
Please find page 51 of the 2012 Kodak annual report below. You can navigate through the pages in the report by either clicking on the pages listed below, or by using the keyword search tool below to find specific information within the annual report.-
 1
1 -
2
-
3
-
4
-
5
-
6
-
7
-
8
-
9
-
10
-
11
-
12
-
13
-
14
-
15
-
16
-
17
-
18
-
19
-
20
-
21
-
22
-
23
-
24
-
25
-
26
-
27
-
28
-
29
-
30
-
31
-
32
-
33
-
34
-
35
-
36
-
37
-
38
-
39
-
40
-
 41
41 -
 42
42 -
 43
43 -
 44
44 -
 45
45 -
 46
46 -
 47
47 -
 48
48 -
 49
49 -
 50
50 -
 51
51 -
 52
52 -
 53
53 -
 54
54 -
 55
55 -
 56
56 -
 57
57 -
 58
58 -
 59
59 -
 60
60 -
 61
61 -
62
-
63
-
64
-
65
-
66
-
67
-
68
-
69
-
70
-
71
-
72
-
73
-
74
-
75
-
76
-
77
-
78
-
79
-
80
-
81
-
82
-
83
-
84
-
85
-
86
-
87
-
88
-
89
-
90
-
91
-
92
-
93
-
94
-
95
-
96
-
97
-
98
-
99
-
100
-
101
-
102
-
103
-
104
-
105
-
106
-
107
-
108
-
109
-
110
-
111
-
112
-
113
-
114
-
115
-
116
-
117
-
118
-
119
-
120
-
121
-
122
-
123
-
124
-
125
-
126
-
127
-
128
-
129
-
130
-
131
-
132
-
133
-
134
-
135
-
136
-
137
-
138
-
139
-
140
-
141
-
142
-
143
-
144
-
145
-
146
-
147
-
148
-
149
-
150
-
151
-
152
-
153
-
154
-
155
-
156
-
157
-
158
-
159
-
160
-
161
-
162
-
163
-
164
-
165
-
166
-
167
-
168
-
169
-
170
-
171
-
172
-
173
-
174
-
175
-
176
-
177
-
178
-
179
-
180
-
181
-
182
-
183
-
184
-
185
-
186
-
187
-
188
-
189
-
190
-
191
-
192
-
193
-
194
-
195
-
196
-
197
-
198
-
199
-
200
-
201
-
202
 |
 |

Table of Contents
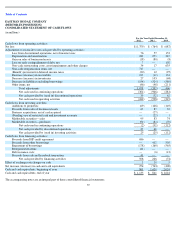
2011
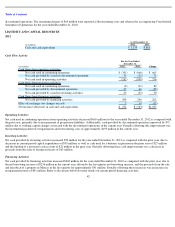
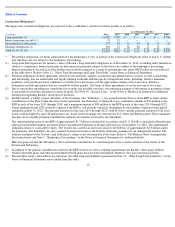
Cash Flow Activity
Operating Activities
Net cash used in operating activities increased $779 million for the year ended December 31, 2011 as compared with the prior year. Cash
received in 2011 related to non-recurring licensing agreements of $82 million was $515 million lower than cash received in 2010 related to non-
recurring licensing agreements, net of applicable withholding taxes, of $597 million. Additionally, the increase in cash used in operating
activities was attributable to a greater use of cash from working capital changes and use of cash for the settlement of other liabilities in the
current year as compared with the prior year.
Investing Activities
Net cash used in investing activities decreased $87 million for the year ended December 31, 2011 as compared with 2010 due primarily to an
increase in proceeds received from sales of assets and businesses and lower capital expenditures. Partially offsetting this was cash used for the
acquisition of a business and to fund restricted cash and investments in trust ensuring payment of various obligations.
Financing Activities
Net cash provided by financing activities increased $320 million for the year ended December 31, 2011 as compared with 2010 due to an
increase in net borrowings.
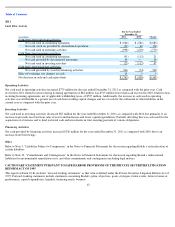
Other
Refer to Note 3, “Liabilities Subject to Compromise” in the Notes to Financial Statements for discussion regarding Kodak’s reclassification of
certain liabilities.
Refer to Note 13, “Commitments and Contingencies” in the Notes to Financial Statements for discussion regarding Kodak’s undiscounted
liabilities for environmental remediation costs, and other commitments and contingencies including legal matters.
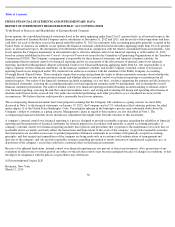
CAUTIONARY STATEMENT PURSUANT TO SAFE HARBOR PROVISIONS OF THE PRIVATE SECURITIES LITIGATION
REFORM ACT OF 1995
This report on Form 10-K, includes “forward–looking statements” as that term is defined under the Private Securities Litigation Reform Act of
1995. Forward–looking statements include statements concerning Kodak’s plans, objectives, goals, strategies, future events, future revenue or
performance, capital expenditures, liquidity, financing needs, business
47
For the Year Ended
December 31,
(in millions)
2011
2010
Change
Cash flows from operating activities:
Net cash used in continuing operations
$
(966
)
$
(281
)
$
(685
)
Net cash (used in) provided by discontinued operations
(32
)
62
(94
)
Net cash used in operating activities
(998
)
(219
)
(779
)
Cash flows from investing activities:
Net cash used in continuing operations
(91
)
(112
)
21
Net cash provided by discontinued operations
66
—
66
Net cash used in investing activities
(25
)
(112
)
87
Cash flows from financing activities:
Net cash provided by (used in) financing activities
246
(74
)
320
Effect of exchange rate changes on cash
14
5
9
Net decrease in cash and cash equivalents
$
(763
)
$
(400
)
$
(363
)