Kodak 2012 Annual Report Download - page 37
Download and view the complete annual report
Please find page 37 of the 2012 Kodak annual report below. You can navigate through the pages in the report by either clicking on the pages listed below, or by using the keyword search tool below to find specific information within the annual report.-
 1
1 -
2
-
3
-
4
-
5
-
6
-
7
-
8
-
9
-
10
-
11
-
12
-
13
-
14
-
15
-
16
-
17
-
18
-
19
-
20
-
21
-
22
-
23
-
24
-
25
-
26
-
 27
27 -
 28
28 -
 29
29 -
 30
30 -
 31
31 -
 32
32 -
 33
33 -
 34
34 -
 35
35 -
 36
36 -
 37
37 -
 38
38 -
 39
39 -
 40
40 -
 41
41 -
 42
42 -
 43
43 -
 44
44 -
 45
45 -
 46
46 -
 47
47 -
48
-
49
-
50
-
51
-
52
-
53
-
54
-
55
-
56
-
57
-
58
-
59
-
60
-
61
-
62
-
63
-
64
-
65
-
66
-
67
-
68
-
69
-
70
-
71
-
72
-
73
-
74
-
75
-
76
-
77
-
78
-
79
-
80
-
81
-
82
-
83
-
84
-
85
-
86
-
87
-
88
-
89
-
90
-
91
-
92
-
93
-
94
-
95
-
96
-
97
-
98
-
99
-
100
-
101
-
102
-
103
-
104
-
105
-
106
-
107
-
108
-
109
-
110
-
111
-
112
-
113
-
114
-
115
-
116
-
117
-
118
-
119
-
120
-
121
-
122
-
123
-
124
-
125
-
126
-
127
-
128
-
129
-
130
-
131
-
132
-
133
-
134
-
135
-
136
-
137
-
138
-
139
-
140
-
141
-
142
-
143
-
144
-
145
-
146
-
147
-
148
-
149
-
150
-
151
-
152
-
153
-
154
-
155
-
156
-
157
-
158
-
159
-
160
-
161
-
162
-
163
-
164
-
165
-
166
-
167
-
168
-
169
-
170
-
171
-
172
-
173
-
174
-
175
-
176
-
177
-
178
-
179
-
180
-
181
-
182
-
183
-
184
-
185
-
186
-
187
-
188
-
189
-
190
-
191
-
192
-
193
-
194
-
195
-
196
-
197
-
198
-
199
-
200
-
201
-
202
 |
 |
Table of Contents
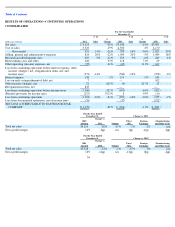
RESULTS OF OPERATIONS—CONTINUING OPERATIONS
CONSOLIDATED
34
For the Year Ended
December 31,
(dollars in millions)
2012
% of
Sales
%
Change
2011
% of
Sales
%
Change
2010
% of
Sales
Net sales
$
4,114
-
20
%
$
5,148
-
14
%
$
5,993
Cost of sales
3,523
-
19
%
4,350
4
%
4,170
Gross profit
591
14
%
-
26
%
798
16
%
-
56
%
1,823
30
%
Selling, general and administrative expenses
824
20
%
-
22
%
1,050
20
%
-
3
%
1,084
18
%
Research and development costs
207
5
%
-
12
%
235
5
%
-
6
%
249
4
%
Restructuring costs and other
228
93
%
118
71
%
69
Other operating (income) expenses, net
(95
)
46
%
(65
)
111
%
619
Loss from continuing operations before interest expense, other
income (charges), net, reorganization items, net, and
income taxes
(573
)
-
14
%
(540
)
-
10
%
(198
)
-
3
%
Interest expense
158
2
%
155
5
%
148
Loss on early extinguishment of debt, net
7
—
102
Other income (charges), net
21
625
%
(4
)
-
117
%
23
Reorganization items, net
843
—
—
Loss from continuing operations before income taxes
(1,560
)
-
123
%
(699
)
-
64
%
(425
)
(Benefit) provision for income taxes
(257
)
3313
%
8
93
%
110
Loss from continuing operations
(1,303
)
-
32
%
-
84
%
(707
)
-
14
%
-
32
%
(535
)
-
9
%
Loss from discontinued operations, net of income taxes
(76
)
(57
)
(152
)
NET LOSS ATTRIBUTABLE TO EASTMAN KODAK
COMPANY
$
(1,379
)
-
80
%
$
(764
)
-
11
%
$
(687
)
For the Year Ended
December 31,
Change vs. 2011
2012
Amount
Change vs.
2011
Volume
Price/
Mix
Foreign
Exchange
Manufacturing
and Other Costs
Total net sales
$
4,114
-
20
%
-
15
%
-
3
%
-
2
%
n/a
Gross profit margin
14
%
-
2pp
n/a
1pp
-
1pp
-
2pp
For the Year Ended
December 31,
Change vs. 2010
2011
Amount
Change vs.
2010
Volume
Price/
Mix
Foreign
Exchange
Manufacturing
and Other Costs
Total net sales
$
5,148
-
14
%
-
1
%
-
15
%
2
%
n/a
Gross profit margin
16
%
-
14pp
n/a
-
12pp
0pp
-
2pp