Kodak 2012 Annual Report Download - page 35
Download and view the complete annual report
Please find page 35 of the 2012 Kodak annual report below. You can navigate through the pages in the report by either clicking on the pages listed below, or by using the keyword search tool below to find specific information within the annual report.-
 1
1 -
2
-
3
-
4
-
5
-
6
-
7
-
8
-
9
-
10
-
11
-
12
-
13
-
14
-
15
-
16
-
17
-
18
-
19
-
20
-
21
-
22
-
23
-
24
-
 25
25 -
 26
26 -
 27
27 -
 28
28 -
 29
29 -
 30
30 -
 31
31 -
 32
32 -
 33
33 -
 34
34 -
 35
35 -
 36
36 -
 37
37 -
 38
38 -
 39
39 -
 40
40 -
 41
41 -
 42
42 -
 43
43 -
 44
44 -
 45
45 -
46
-
47
-
48
-
49
-
50
-
51
-
52
-
53
-
54
-
55
-
56
-
57
-
58
-
59
-
60
-
61
-
62
-
63
-
64
-
65
-
66
-
67
-
68
-
69
-
70
-
71
-
72
-
73
-
74
-
75
-
76
-
77
-
78
-
79
-
80
-
81
-
82
-
83
-
84
-
85
-
86
-
87
-
88
-
89
-
90
-
91
-
92
-
93
-
94
-
95
-
96
-
97
-
98
-
99
-
100
-
101
-
102
-
103
-
104
-
105
-
106
-
107
-
108
-
109
-
110
-
111
-
112
-
113
-
114
-
115
-
116
-
117
-
118
-
119
-
120
-
121
-
122
-
123
-
124
-
125
-
126
-
127
-
128
-
129
-
130
-
131
-
132
-
133
-
134
-
135
-
136
-
137
-
138
-
139
-
140
-
141
-
142
-
143
-
144
-
145
-
146
-
147
-
148
-
149
-
150
-
151
-
152
-
153
-
154
-
155
-
156
-
157
-
158
-
159
-
160
-
161
-
162
-
163
-
164
-
165
-
166
-
167
-
168
-
169
-
170
-
171
-
172
-
173
-
174
-
175
-
176
-
177
-
178
-
179
-
180
-
181
-
182
-
183
-
184
-
185
-
186
-
187
-
188
-
189
-
190
-
191
-
192
-
193
-
194
-
195
-
196
-
197
-
198
-
199
-
200
-
201
-
202
 |
 |

Table of Contents
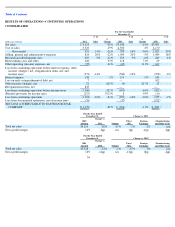
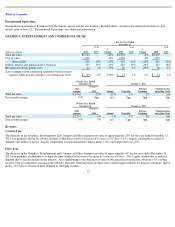
DETAILED RESULTS OF OPERATIONS
Net Sales from Continuing Operations by Reportable Segment (1)
32
For the Year Ended December 31,
(in millions)
2012
Change
Foreign
Currency
Impact
2011
Change
Foreign
Currency
Impact
2010
Graphics, Entertainment and Commercial Films
Inside the U.S.
$
440
-
14
%
0
%
$
509
-
15
%
0
%
$
602
Outside the U.S.
1,302
-
25
-
3
1,742
-
3
+4
1,805
Total Graphics, Entertainment and Commercial Films
1,742
-
23
-
2
2,251
-
6
+3
2,407
Digital Printing and Enterprise
Inside the U.S.
432
-
15
0
510
+6
0
483
Outside the U.S.
508
-
14
-
3
588
+26
+4
467
Total Digital Printing and Enterprise
940
-
14
-
2
1,098
+16
+2
950
Personalized and Document Imaging
Inside the U.S.
427
-
31
0
618
-
58
0
1,480
Outside the U.S.
1,005
-
15
-
4
1,181
+2
+3
1,156
Total Personalized and Document Imaging
1,432
-
20
-
3
1,799
-
32
+1
2,636
Consolidated
Inside the U.S.
1,299
-
21
0
1,637
-
36
0
2,565
Outside the U.S.
2,815
-
20
-
3
3,511
+2
+4
3,428
Consolidated Total
$
4,114
-
20
%
-
2
%
$
5,148
-
14
%
+2
%
$
5,993
(1)
Sales are reported based on the geographic area of destination.