Kodak 2012 Annual Report Download - page 41
Download and view the complete annual report
Please find page 41 of the 2012 Kodak annual report below. You can navigate through the pages in the report by either clicking on the pages listed below, or by using the keyword search tool below to find specific information within the annual report.-
 1
1 -
2
-
3
-
4
-
5
-
6
-
7
-
8
-
9
-
10
-
11
-
12
-
13
-
14
-
15
-
16
-
17
-
18
-
19
-
20
-
21
-
22
-
23
-
24
-
25
-
26
-
27
-
28
-
29
-
30
-
 31
31 -
 32
32 -
 33
33 -
 34
34 -
 35
35 -
 36
36 -
 37
37 -
 38
38 -
 39
39 -
 40
40 -
 41
41 -
 42
42 -
 43
43 -
 44
44 -
 45
45 -
 46
46 -
 47
47 -
 48
48 -
 49
49 -
 50
50 -
 51
51 -
52
-
53
-
54
-
55
-
56
-
57
-
58
-
59
-
60
-
61
-
62
-
63
-
64
-
65
-
66
-
67
-
68
-
69
-
70
-
71
-
72
-
73
-
74
-
75
-
76
-
77
-
78
-
79
-
80
-
81
-
82
-
83
-
84
-
85
-
86
-
87
-
88
-
89
-
90
-
91
-
92
-
93
-
94
-
95
-
96
-
97
-
98
-
99
-
100
-
101
-
102
-
103
-
104
-
105
-
106
-
107
-
108
-
109
-
110
-
111
-
112
-
113
-
114
-
115
-
116
-
117
-
118
-
119
-
120
-
121
-
122
-
123
-
124
-
125
-
126
-
127
-
128
-
129
-
130
-
131
-
132
-
133
-
134
-
135
-
136
-
137
-
138
-
139
-
140
-
141
-
142
-
143
-
144
-
145
-
146
-
147
-
148
-
149
-
150
-
151
-
152
-
153
-
154
-
155
-
156
-
157
-
158
-
159
-
160
-
161
-
162
-
163
-
164
-
165
-
166
-
167
-
168
-
169
-
170
-
171
-
172
-
173
-
174
-
175
-
176
-
177
-
178
-
179
-
180
-
181
-
182
-
183
-
184
-
185
-
186
-
187
-
188
-
189
-
190
-
191
-
192
-
193
-
194
-
195
-
196
-
197
-
198
-
199
-
200
-
201
-
202
 |
 |
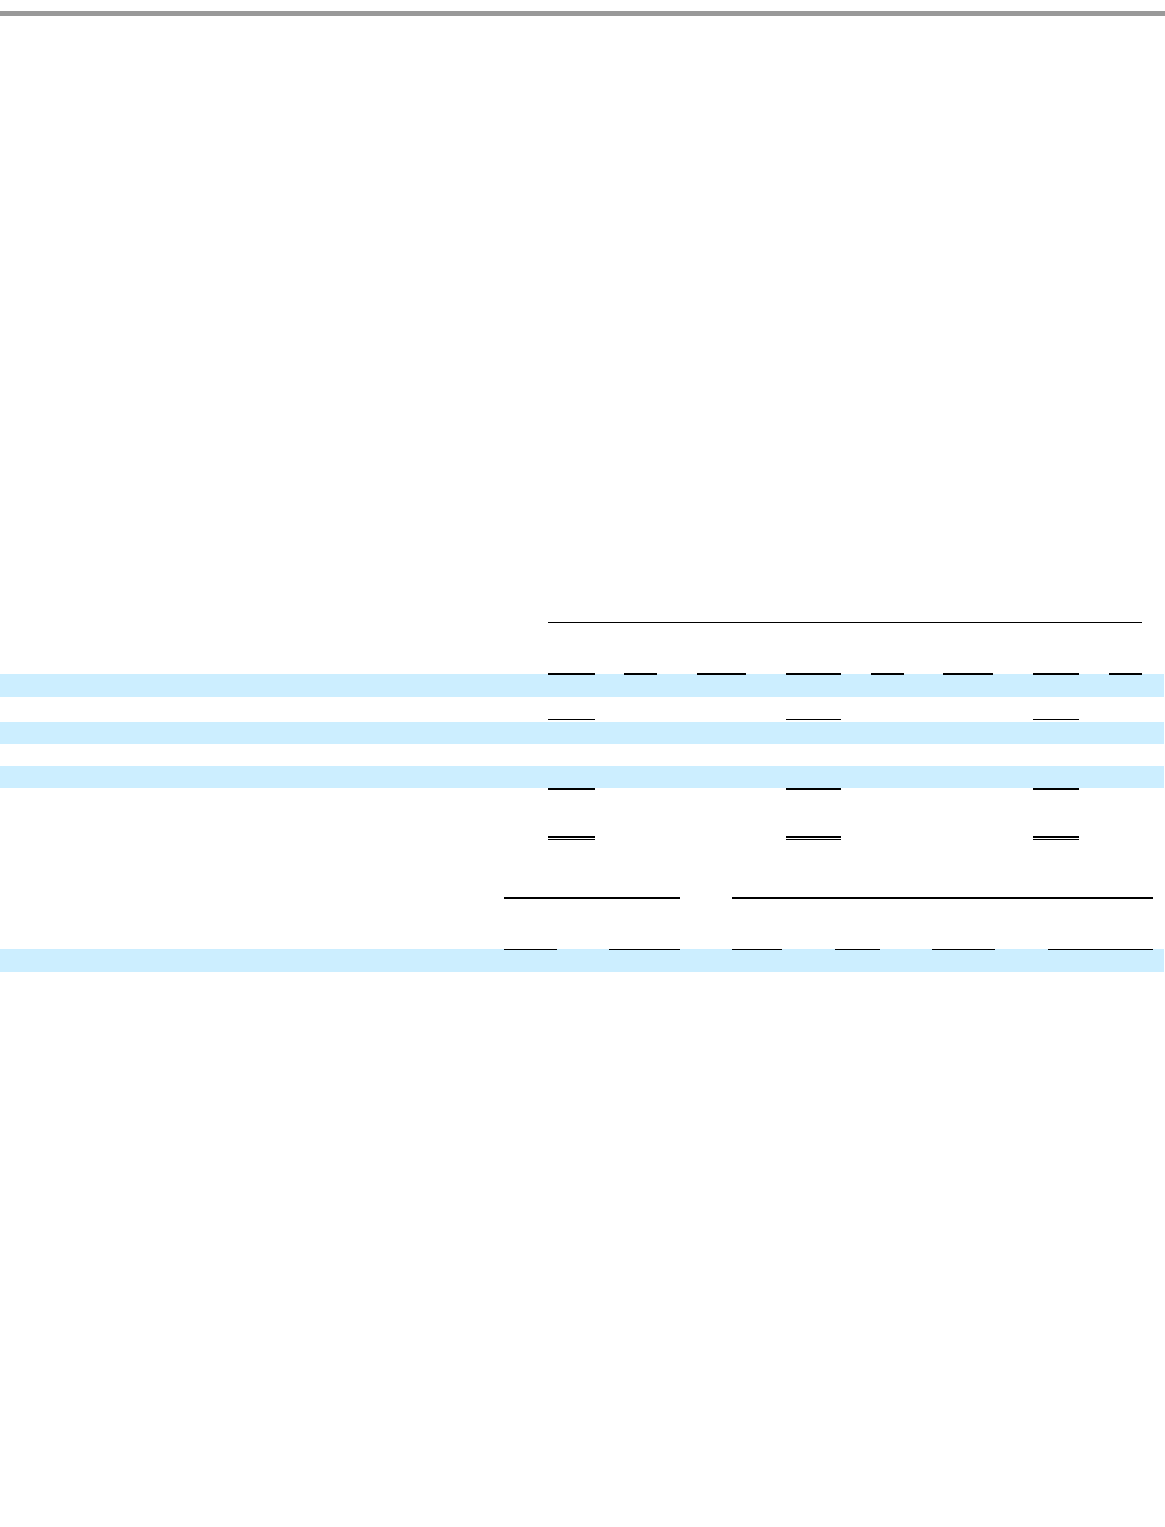
Table of Contents
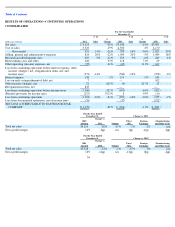
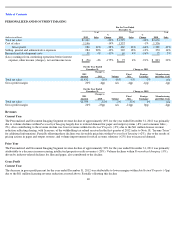
Gross Profit
Current Year
The decrease in the Graphics, Entertainment and Commercial Films Segment gross profit percent for the year ended December 31, 2012 was due
to unfavorable price/mix in Graphics (-1pp) largely due to competitive pricing within the prepress solutions industry and increased costs within
Entertainment Imaging & Commercial Films
(-2pp) driven by lower production volumes.
Prior Year
The decrease in the gross profit percent in the Graphics, Entertainment and Commercial Films Segment for the year ended December 31, 2011
was driven by higher costs within Entertainment Imaging & Commercial Films primarily related to silver (-4pp). In addition, unfavorable
price/mix for prepress solutions (-1pp) within Graphics , due to competitive pricing within the industry, contributed to the decline.
Selling, General and Administrative Expenses
The decreases in SG&A from 2011 to 2012 and 2010 to 2011 were primarily the result of cost reduction actions.
Research and Development Costs
The decreases in R&D from 2011 to 2012 and 2010 to 2011 were primarily attributable to cost reduction actions.
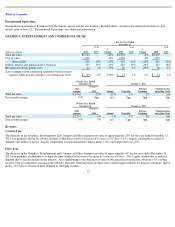
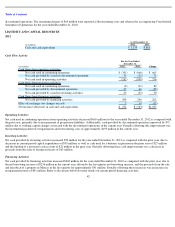
DIGITAL PRINTING AND ENTERPRISE
38
For the Year Ended
December 31,
(dollars in millions)
2012
% of
Sales
%
Change
2011
% of
Sales
%
Change
2010
% of
Sales
Total net sales
$
940
-
14
%
$
1,098
16
%
$
950
Cost of sales
806
-
29
%
1,132
20
%
946
Gross profit
134
14
%
494
%
(34
)
-
3
%
-
950
%
4
0
%
Selling, general and administrative expenses
243
26
%
-
36
%
381
35
%
18
%
322
34
%
Research and development costs
102
11
%
-
15
%
120
11
%
2
%
118
12
%
Loss from continuing operations before interest expense, other
income (charges), net and income taxes
$
(211
)
-
22
%
61
%
$
(535
)
-
49
%
-
23
%
$
(436
)
-
46
%
For the Year Ended
December 31,
Change vs. 2011
2012
Amount
Change vs.
2011
Volume
Price/
Mix
Foreign
Exchange
Manufacturing
and Other Costs
Total net sales
$
940
-
14
%
-
14
%
1
%
-
1
%
n/a
Gross profit margin
14
%
17pp
n/a
15pp
-
1pp
3pp