Kodak 2012 Annual Report Download - page 103
Download and view the complete annual report
Please find page 103 of the 2012 Kodak annual report below. You can navigate through the pages in the report by either clicking on the pages listed below, or by using the keyword search tool below to find specific information within the annual report.-
 1
1 -
2
-
3
-
4
-
5
-
6
-
7
-
8
-
9
-
10
-
11
-
12
-
13
-
14
-
15
-
16
-
17
-
18
-
19
-
20
-
21
-
22
-
23
-
24
-
25
-
26
-
27
-
28
-
29
-
30
-
31
-
32
-
33
-
34
-
35
-
36
-
37
-
38
-
39
-
40
-
41
-
42
-
43
-
44
-
45
-
46
-
47
-
48
-
49
-
50
-
51
-
52
-
53
-
54
-
55
-
56
-
57
-
58
-
59
-
60
-
61
-
62
-
63
-
64
-
65
-
66
-
67
-
68
-
69
-
70
-
71
-
72
-
73
-
74
-
75
-
76
-
77
-
78
-
79
-
80
-
81
-
82
-
83
-
84
-
85
-
86
-
87
-
88
-
89
-
90
-
91
-
92
-
 93
93 -
 94
94 -
 95
95 -
 96
96 -
 97
97 -
 98
98 -
 99
99 -
 100
100 -
 101
101 -
 102
102 -
 103
103 -
 104
104 -
 105
105 -
 106
106 -
 107
107 -
 108
108 -
 109
109 -
 110
110 -
 111
111 -
 112
112 -
 113
113 -
114
-
115
-
116
-
117
-
118
-
119
-
120
-
121
-
122
-
123
-
124
-
125
-
126
-
127
-
128
-
129
-
130
-
131
-
132
-
133
-
134
-
135
-
136
-
137
-
138
-
139
-
140
-
141
-
142
-
143
-
144
-
145
-
146
-
147
-
148
-
149
-
150
-
151
-
152
-
153
-
154
-
155
-
156
-
157
-
158
-
159
-
160
-
161
-
162
-
163
-
164
-
165
-
166
-
167
-
168
-
169
-
170
-
171
-
172
-
173
-
174
-
175
-
176
-
177
-
178
-
179
-
180
-
181
-
182
-
183
-
184
-
185
-
186
-
187
-
188
-
189
-
190
-
191
-
192
-
193
-
194
-
195
-
196
-
197
-
198
-
199
-
200
-
201
-
202
 |
 |

Table of Contents
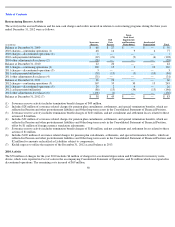
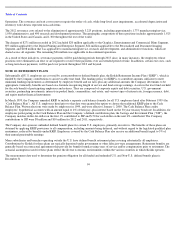
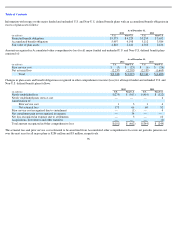
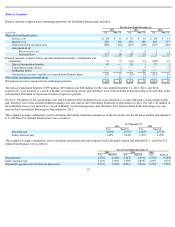
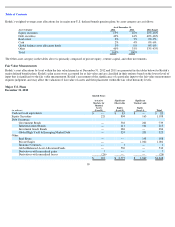
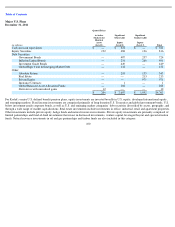
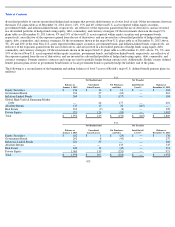
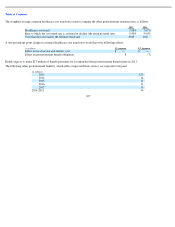
Kodak’s weighted-average asset allocations for its major non-U.S. defined benefit pension plans, by asset category are as follows:
The Other asset category in the tables above is primarily composed of private equity, venture capital, and other investments.
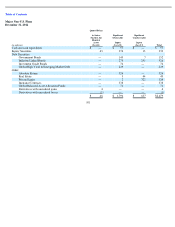
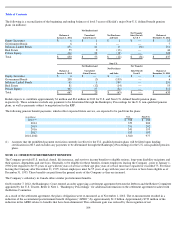
Fair Value Measurements
Kodak’s asset allocations by level within the fair value hierarchy at December 31, 2012 and 2011 are presented in the tables below for Kodak’s
major defined benefit plans. Kodak’s plan assets were accounted for at fair value and are classified in their entirety based on the lowest level of
input that is significant to the fair value measurement. Kodak’s assessment of the significance of a particular input to the fair value measurement
requires judgment, and may affect the valuation of fair value of assets and their placement within the fair value hierarchy levels.
Major U.S. Plans
December 31, 2012
99
As of December 31,
Asset Category
2012
2011
2012 Target
Equity securities
13
%
16
%
11%
-
18%
Debt securities
40
%
44
%
40%
-
48%
Real estate
2
%
3
%
0%
-
9%
Cash
2
%
4
%
0%
-
6%
Global balance asset allocation funds
3
%
0
%
0%
-
6%
Other
40
%
33
%
33%
-
43%
Total
100
%
100
%
(in millions)
Quoted Prices
in Active
Markets for
Identical
Assets
(Level 1)
Significant
Observable
Inputs
(Level 2)
Significant
Unobservable
Inputs
(Level 3)
Total
Cash and cash equivalents
$
—
$
83
$
—
$
83
Equity Securities
221
804
163
1,188
Debt Securities:
Government Bonds
—
538
201
739
Inflation
-
Linked Bonds
—
111
104
215
Investment Grade Bonds
—
386
—
386
Global High Yield & Emerging Market Debt
—
324
201
525
Other:
Real Estate
—
—
198
198
Private Equity
—
—
1,002
1,002
Insurance Contracts
—
1
—
1
Global Balanced Asset Allocation Funds
—
530
—
530
Derivatives with unrealized gains
7
—
—
7
Derivatives with unrealized losses
(26
)
—
—
(
26
)
$
202
$
2,777
$
1,869
$
4,848