Kodak 2012 Annual Report Download - page 101
Download and view the complete annual report
Please find page 101 of the 2012 Kodak annual report below. You can navigate through the pages in the report by either clicking on the pages listed below, or by using the keyword search tool below to find specific information within the annual report.-
 1
1 -
2
-
3
-
4
-
5
-
6
-
7
-
8
-
9
-
10
-
11
-
12
-
13
-
14
-
15
-
16
-
17
-
18
-
19
-
20
-
21
-
22
-
23
-
24
-
25
-
26
-
27
-
28
-
29
-
30
-
31
-
32
-
33
-
34
-
35
-
36
-
37
-
38
-
39
-
40
-
41
-
42
-
43
-
44
-
45
-
46
-
47
-
48
-
49
-
50
-
51
-
52
-
53
-
54
-
55
-
56
-
57
-
58
-
59
-
60
-
61
-
62
-
63
-
64
-
65
-
66
-
67
-
68
-
69
-
70
-
71
-
72
-
73
-
74
-
75
-
76
-
77
-
78
-
79
-
80
-
81
-
82
-
83
-
84
-
85
-
86
-
87
-
88
-
89
-
90
-
 91
91 -
 92
92 -
 93
93 -
 94
94 -
 95
95 -
 96
96 -
 97
97 -
 98
98 -
 99
99 -
 100
100 -
 101
101 -
 102
102 -
 103
103 -
 104
104 -
 105
105 -
 106
106 -
 107
107 -
 108
108 -
 109
109 -
 110
110 -
 111
111 -
112
-
113
-
114
-
115
-
116
-
117
-
118
-
119
-
120
-
121
-
122
-
123
-
124
-
125
-
126
-
127
-
128
-
129
-
130
-
131
-
132
-
133
-
134
-
135
-
136
-
137
-
138
-
139
-
140
-
141
-
142
-
143
-
144
-
145
-
146
-
147
-
148
-
149
-
150
-
151
-
152
-
153
-
154
-
155
-
156
-
157
-
158
-
159
-
160
-
161
-
162
-
163
-
164
-
165
-
166
-
167
-
168
-
169
-
170
-
171
-
172
-
173
-
174
-
175
-
176
-
177
-
178
-
179
-
180
-
181
-
182
-
183
-
184
-
185
-
186
-
187
-
188
-
189
-
190
-
191
-
192
-
193
-
194
-
195
-
196
-
197
-
198
-
199
-
200
-
201
-
202
 |
 |

Table of Contents
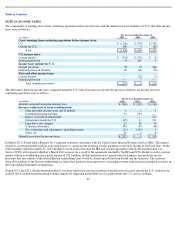
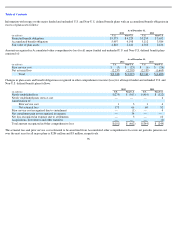
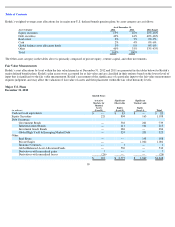
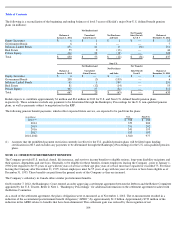
Pension (income) expense from continuing operations for all defined benefit plans included:
The special termination benefits of $99 million, $29 million, and $28 million for the years ended December 31, 2012, 2011, and 2010,
respectively, were incurred as a result of Kodak’s restructuring actions and, therefore, have been included in Restructuring costs and other in the
Consolidated Statement of Operations for those respective periods.
For 2011, $3 million of the curtailment losses and $1 million of the settlement losses were incurred as a result of Kodak’s restructuring actions
and, therefore, have been included in Restructuring costs and other in the Consolidate Statement of Operations for 2011. For 2012, $1 million of
the settlement losses were incurred as a result of Kodak’s restructuring actions and, therefore, have been included in Restructuring costs and
other in the Consolidated Statement of Operations for 2012.
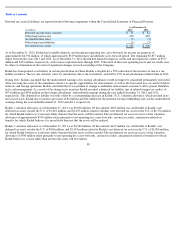
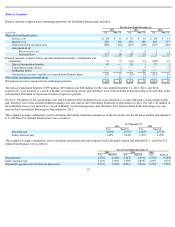
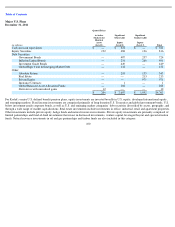
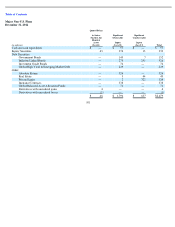
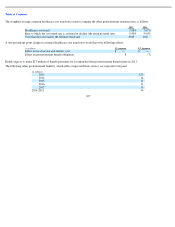
The weighted-average assumptions used to determine the benefit obligation amounts as of the end of the year for all major funded and unfunded
U.S. and Non-U.S. defined benefit plans were as follows:
The weighted-average assumptions used to determine net pension (income) expense for all the major funded and unfunded U.S. and Non-U.S.
defined benefit plans were as follows:
97
For the Year Ended December 31,
2012
2011
2010
(in millions)
U.S.
Non
-
U.S.
U.S.
Non
-
U.S.
U.S.
Non
-
U.S.
Major defined benefit plans:
Service cost
$
48
$
10
$
50
$
16
$
48
$
14
Interest cost
206
156
254
180
263
177
Expected return on plan assets
(389
)
(164
)
(435
)
(209
)
(475
)
(210
)
Amortization of:
Prior service cost
1
3
1
4
1
1
Actuarial loss
173
66
69
52
5
37
Pension (income) expense before special termination benefits, curtailments and
settlements
39
71
(61
)
43
(158
)
19
Special termination benefits
99
—
28
1
27
1
Curtailment (gains) losses
—
(
1
)
—
4
—
(
7
)
Settlement losses
—
3
—
10
—
1
Net pension (income) expense for major defined benefit plans
138
73
(33
)
58
(131
)
14
Other plans including unfunded plans
—
11
—
12
—
11
Net pension (income) expense from continuing operations
$
138
$
84
$
(33
)
$
70
$
(131
)
$
25
As of December 31,
2012
2011
U.S.
Non
-
U.S.
U.S.
Non
-
U.S.
Discount rate
3.50
%
3.55
%
4.25
%
4.37
%
Salary increase rate
3.40
%
2.84
%
3.45
%
2.99
%
For the Year Ended December 31,
2012
2011
2010
U.S.
Non
-
U.S.
U.S.
Non
-
U.S.
U.S.
Non
-
U.S.
Discount rate
4.25
%
4.41
%
5.24
%
4.95
%
5.75
%
5.39
%
Salary increase rate
3.45
%
2.98
%
3.99
%
3.89
%
4.05
%
3.87
%
Expected long
-
term rate of return on plan assets
8.52
%
7.02
%
8.43
%
7.64
%
8.73
%
7.76
%