Kodak 2012 Annual Report Download - page 68
Download and view the complete annual report
Please find page 68 of the 2012 Kodak annual report below. You can navigate through the pages in the report by either clicking on the pages listed below, or by using the keyword search tool below to find specific information within the annual report.-
 1
1 -
2
-
3
-
4
-
5
-
6
-
7
-
8
-
9
-
10
-
11
-
12
-
13
-
14
-
15
-
16
-
17
-
18
-
19
-
20
-
21
-
22
-
23
-
24
-
25
-
26
-
27
-
28
-
29
-
30
-
31
-
32
-
33
-
34
-
35
-
36
-
37
-
38
-
39
-
40
-
41
-
42
-
43
-
44
-
45
-
46
-
47
-
48
-
49
-
50
-
51
-
52
-
53
-
54
-
55
-
56
-
57
-
 58
58 -
 59
59 -
 60
60 -
 61
61 -
 62
62 -
 63
63 -
 64
64 -
 65
65 -
 66
66 -
 67
67 -
 68
68 -
 69
69 -
 70
70 -
 71
71 -
 72
72 -
 73
73 -
 74
74 -
 75
75 -
 76
76 -
 77
77 -
 78
78 -
79
-
80
-
81
-
82
-
83
-
84
-
85
-
86
-
87
-
88
-
89
-
90
-
91
-
92
-
93
-
94
-
95
-
96
-
97
-
98
-
99
-
100
-
101
-
102
-
103
-
104
-
105
-
106
-
107
-
108
-
109
-
110
-
111
-
112
-
113
-
114
-
115
-
116
-
117
-
118
-
119
-
120
-
121
-
122
-
123
-
124
-
125
-
126
-
127
-
128
-
129
-
130
-
131
-
132
-
133
-
134
-
135
-
136
-
137
-
138
-
139
-
140
-
141
-
142
-
143
-
144
-
145
-
146
-
147
-
148
-
149
-
150
-
151
-
152
-
153
-
154
-
155
-
156
-
157
-
158
-
159
-
160
-
161
-
162
-
163
-
164
-
165
-
166
-
167
-
168
-
169
-
170
-
171
-
172
-
173
-
174
-
175
-
176
-
177
-
178
-
179
-
180
-
181
-
182
-
183
-
184
-
185
-
186
-
187
-
188
-
189
-
190
-
191
-
192
-
193
-
194
-
195
-
196
-
197
-
198
-
199
-
200
-
201
-
202
 |
 |

Table of Contents
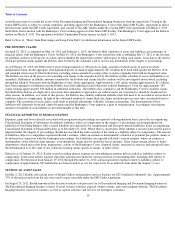
2017. This change in useful lives reflects Kodak’s current estimate of future periods to be benefited from the use of the property, plant, and
equipment.
The effect of this change in estimate for the year ended December 31, 2011 was a reduction in depreciation expense of $38 million, $32 million
of which would have been recognized in Cost of sales, and $6 million of which would have been capitalized as inventories at December 31,
2011. The net impact of this change is an increase in earnings from continuing operations for the year ended December 31, 2011 of $32 million,
or $.12 on a fully-diluted earnings per share basis.
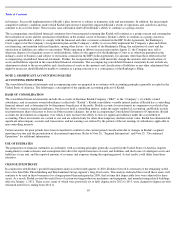
FOREIGN CURRENCY
For most subsidiaries and branches outside the U.S., the local currency is the functional currency. The financial statements of these subsidiaries
and branches are translated into U.S. dollars as follows: assets and liabilities at year-end exchange rates; income, expenses and cash flows at
average exchange rates; and shareholders’
equity at historical exchange rates. For those subsidiaries for which the local currency is the functional
currency, the resulting translation adjustment is recorded as a component of Accumulated other comprehensive (loss) income in the
accompanying Consolidated Statement of Financial Position. Translation adjustments related to investments that are permanent in nature are not
tax-effected.
For certain other subsidiaries and branches, operations are conducted primarily in U.S. dollars, which is therefore the functional currency.
Monetary assets and liabilities of these foreign subsidiaries and branches, which are recorded in local currency, are remeasured at year-end
exchange rates, while the related revenue, expense, and gain and loss accounts, which are recorded in local currency, are remeasured at average
exchange rates. Non-monetary assets and liabilities, and the related revenue, expense, and gain and loss accounts, are remeasured at historical
rates. Adjustments that result from the remeasurement of the assets and liabilities of these subsidiaries are included in Net (loss) earnings in the
accompanying Consolidated Statement of Operations.
The effects of foreign currency transactions, including related hedging activities, are included in Other income (charges), net, in the
accompanying Consolidated Statement of Operations.
CONCENTRATION OF CREDIT RISK
Financial instruments that potentially subject Kodak to significant concentrations of credit risk consist principally of cash and cash equivalents,
receivables, and derivative instruments. Kodak places its cash and cash equivalents with high-quality financial institutions and limits the amount
of credit exposure to any one institution. With respect to receivables, such receivables arise from sales to numerous customers in a variety of
industries, markets, and geographies around the world. Receivables arising from these sales are generally not collateralized. Kodak performs
ongoing credit evaluations of its customers’ financial conditions, and maintains reserves for potential credit losses and such losses, in the
aggregate, have not exceeded management’s expectations. With respect to the derivative instruments, the counterparties to these contracts are
major financial institutions. Kodak has not experienced non-performance by any of its derivative instruments counterparties.
DERIVATIVE FINANCIAL INSTRUMENTS
All derivative instruments are recognized as either assets or liabilities and are measured at fair value. Certain derivatives are designated and
accounted for as hedges. Kodak does not use derivatives for trading or other speculative purposes. See Note 15, “Financial Instruments.”
CASH EQUIVALENTS
All highly liquid investments with a remaining maturity of three months or less at date of purchase are considered to be cash equivalents.
INVENTORIES
Inventories are stated at the lower of cost or market. The cost of all of Kodak’s inventories is determined by either the “first in, first
out” (“FIFO”) or average cost method, which approximates current cost. Kodak provides inventory reserves for excess, obsolete or slow-
moving
inventory based on changes in customer demand, technology developments or other economic factors.
PROPERTIES
64