Kodak 2012 Annual Report Download - page 61
Download and view the complete annual report
Please find page 61 of the 2012 Kodak annual report below. You can navigate through the pages in the report by either clicking on the pages listed below, or by using the keyword search tool below to find specific information within the annual report.-
 1
1 -
2
-
3
-
4
-
5
-
6
-
7
-
8
-
9
-
10
-
11
-
12
-
13
-
14
-
15
-
16
-
17
-
18
-
19
-
20
-
21
-
22
-
23
-
24
-
25
-
26
-
27
-
28
-
29
-
30
-
31
-
32
-
33
-
34
-
35
-
36
-
37
-
38
-
39
-
40
-
41
-
42
-
43
-
44
-
45
-
46
-
47
-
48
-
49
-
50
-
 51
51 -
 52
52 -
 53
53 -
 54
54 -
 55
55 -
 56
56 -
 57
57 -
 58
58 -
 59
59 -
 60
60 -
 61
61 -
 62
62 -
 63
63 -
 64
64 -
 65
65 -
 66
66 -
 67
67 -
 68
68 -
 69
69 -
 70
70 -
 71
71 -
72
-
73
-
74
-
75
-
76
-
77
-
78
-
79
-
80
-
81
-
82
-
83
-
84
-
85
-
86
-
87
-
88
-
89
-
90
-
91
-
92
-
93
-
94
-
95
-
96
-
97
-
98
-
99
-
100
-
101
-
102
-
103
-
104
-
105
-
106
-
107
-
108
-
109
-
110
-
111
-
112
-
113
-
114
-
115
-
116
-
117
-
118
-
119
-
120
-
121
-
122
-
123
-
124
-
125
-
126
-
127
-
128
-
129
-
130
-
131
-
132
-
133
-
134
-
135
-
136
-
137
-
138
-
139
-
140
-
141
-
142
-
143
-
144
-
145
-
146
-
147
-
148
-
149
-
150
-
151
-
152
-
153
-
154
-
155
-
156
-
157
-
158
-
159
-
160
-
161
-
162
-
163
-
164
-
165
-
166
-
167
-
168
-
169
-
170
-
171
-
172
-
173
-
174
-
175
-
176
-
177
-
178
-
179
-
180
-
181
-
182
-
183
-
184
-
185
-
186
-
187
-
188
-
189
-
190
-
191
-
192
-
193
-
194
-
195
-
196
-
197
-
198
-
199
-
200
-
201
-
202
 |
 |
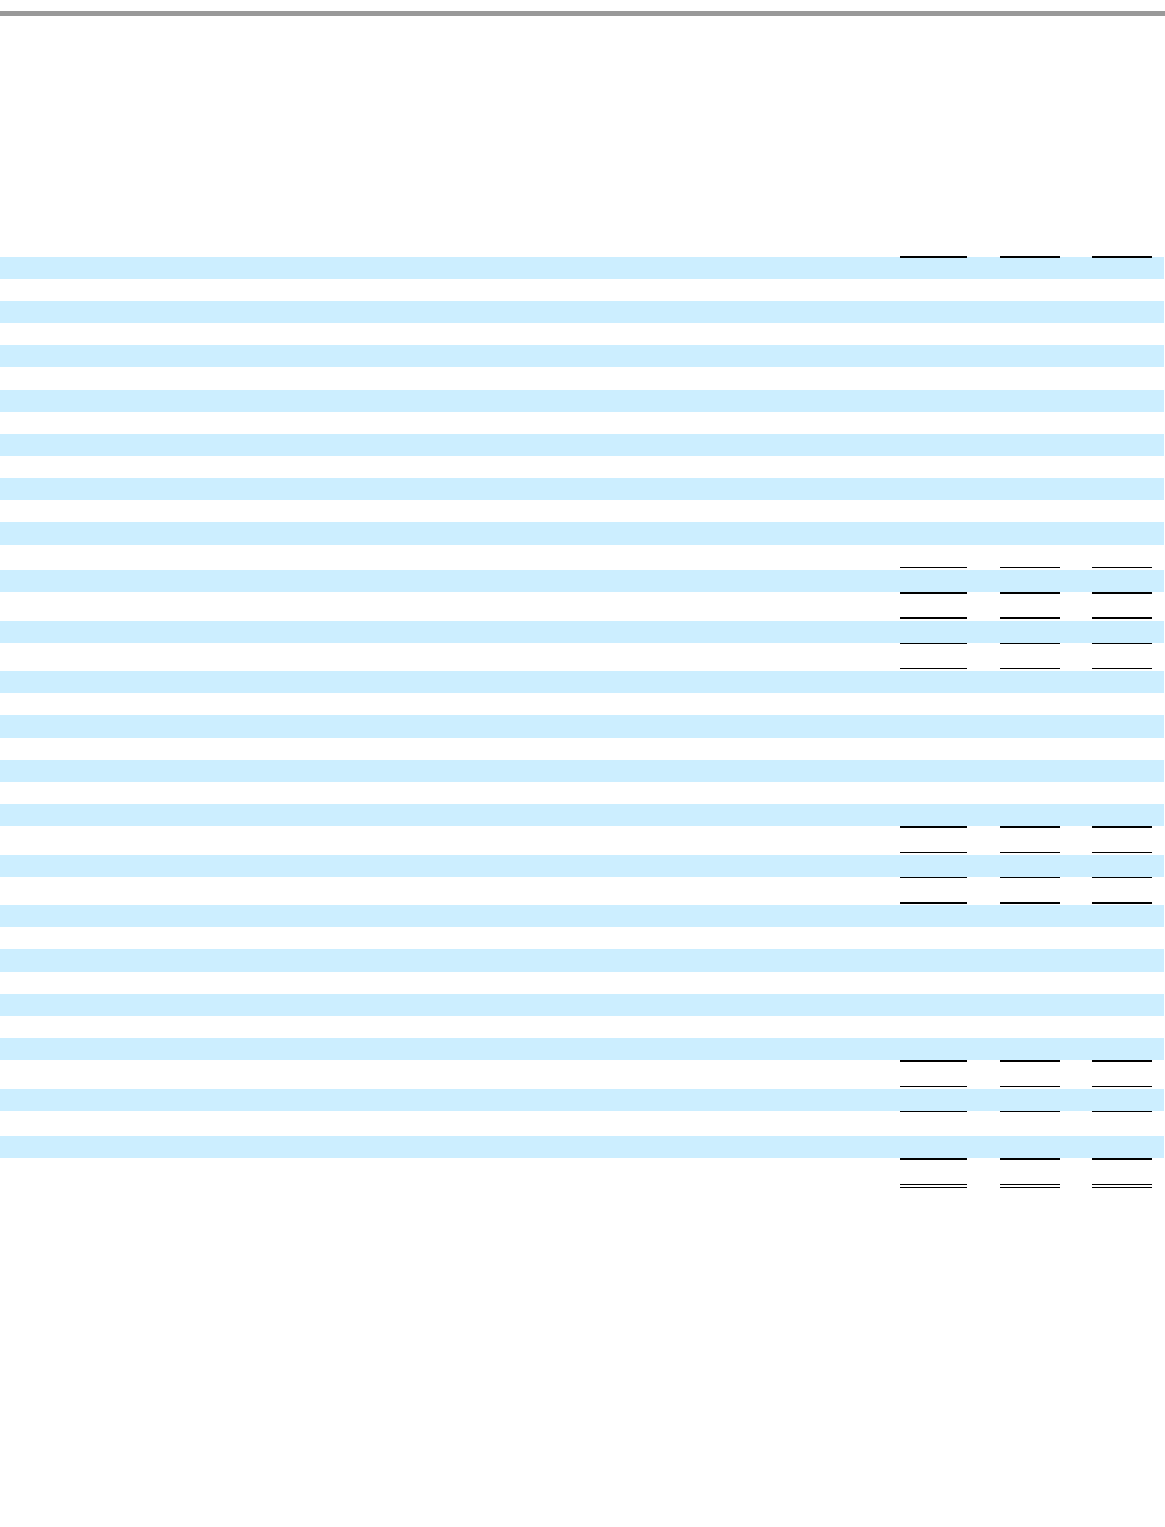
Table of Contents
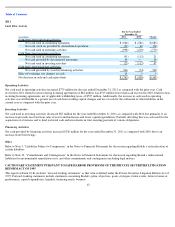
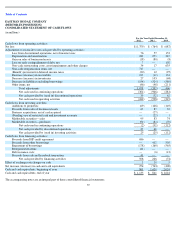
EASTMAN KODAK COMPANY
(DEBTOR-IN-POSSESSION)
CONSOLIDATED STATEMENT OF CASH FLOWS
(in millions)
The accompanying notes are an integral part of these consolidated financial statements.
57
For the Year Ended December 31,
2012
2011
2010
Cash flows from operating activities:
Net loss
$
(1,379
)
$
(764
)
$
(687
)
Adjustments to reconcile to net cash provided by operating activities:
Loss from discontinued operations, net of income taxes
76
57
152
Depreciation and amortization
242
273
345
Gain on sales of businesses/assets
(18
)
(80
)
(8
)
Loss on early extinguishment of debt, net
7
—
102
Non
-
cash restructuring costs, asset impairments and other charges
34
17
635
Non
-
cash reorganization items, net
717
—
—
(Benefit) provision for deferred income taxes
(20
)
12
(95
)
Decrease (increase) in receivables
213
(12
)
134
Decrease (increase) in inventories
27
103
(68
)
Decrease in liabilities excluding borrowings
(154
)
(524
)
(580
)
Other items, net
(46
)
(48
)
(211
)
Total adjustments
1,078
(202
)
406
Net cash used in continuing operations
(301
)
(966
)
(281
)
Net cash provided by (used in) discontinued operations
39
(32
)
62
Net cash used in operating activities
(262
)
(998
)
(219
)
Cash flows from investing activities:
Additions to properties
(69
)
(128
)
(149
)
Proceeds from sales of businesses/assets
63
87
32
Business acquisitions, net of cash acquired
—
(
27
)
—
(Funding) use of restricted cash and investment accounts
—
(
22
)
1
Marketable securities
—
sales
95
83
74
Marketable securities
—
purchases
(91
)
(84
)
(70
)
Net cash used in continuing operations
(2
)
(91
)
(112
)
Net cash provided by discontinued operations
27
66
—
Net cash provided by (used in) investing activities
25
(25
)
(112
)
Cash flows from financing activities:
Proceeds from DIP credit agreement
686
—
—
Proceeds from other borrowings
—
412
503
Repayment of borrowings
(178
)
(160
)
(565
)
Reorganization items
(41
)
—
—
Debt issuance costs
—
(
6
)
(12
)
Proceeds from sale and leaseback transaction
41
—
—
Net cash provided by financing activities
508
246
(74
)
Effect of exchange rate changes on cash
3
14
5
Net increase (decrease) in cash and cash equivalents
274
(763
)
(400
)
Cash and cash equivalents, beginning of year
861
1,624
2,024
Cash and cash equivalents, end of year
$
1,135
$
861
$
1,624