Kodak 2012 Annual Report Download - page 43
Download and view the complete annual report
Please find page 43 of the 2012 Kodak annual report below. You can navigate through the pages in the report by either clicking on the pages listed below, or by using the keyword search tool below to find specific information within the annual report.-
 1
1 -
2
-
3
-
4
-
5
-
6
-
7
-
8
-
9
-
10
-
11
-
12
-
13
-
14
-
15
-
16
-
17
-
18
-
19
-
20
-
21
-
22
-
23
-
24
-
25
-
26
-
27
-
28
-
29
-
30
-
31
-
32
-
 33
33 -
 34
34 -
 35
35 -
 36
36 -
 37
37 -
 38
38 -
 39
39 -
 40
40 -
 41
41 -
 42
42 -
 43
43 -
 44
44 -
 45
45 -
 46
46 -
 47
47 -
 48
48 -
 49
49 -
 50
50 -
 51
51 -
 52
52 -
 53
53 -
54
-
55
-
56
-
57
-
58
-
59
-
60
-
61
-
62
-
63
-
64
-
65
-
66
-
67
-
68
-
69
-
70
-
71
-
72
-
73
-
74
-
75
-
76
-
77
-
78
-
79
-
80
-
81
-
82
-
83
-
84
-
85
-
86
-
87
-
88
-
89
-
90
-
91
-
92
-
93
-
94
-
95
-
96
-
97
-
98
-
99
-
100
-
101
-
102
-
103
-
104
-
105
-
106
-
107
-
108
-
109
-
110
-
111
-
112
-
113
-
114
-
115
-
116
-
117
-
118
-
119
-
120
-
121
-
122
-
123
-
124
-
125
-
126
-
127
-
128
-
129
-
130
-
131
-
132
-
133
-
134
-
135
-
136
-
137
-
138
-
139
-
140
-
141
-
142
-
143
-
144
-
145
-
146
-
147
-
148
-
149
-
150
-
151
-
152
-
153
-
154
-
155
-
156
-
157
-
158
-
159
-
160
-
161
-
162
-
163
-
164
-
165
-
166
-
167
-
168
-
169
-
170
-
171
-
172
-
173
-
174
-
175
-
176
-
177
-
178
-
179
-
180
-
181
-
182
-
183
-
184
-
185
-
186
-
187
-
188
-
189
-
190
-
191
-
192
-
193
-
194
-
195
-
196
-
197
-
198
-
199
-
200
-
201
-
202
 |
 |

Table of Contents
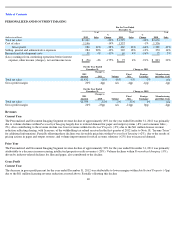
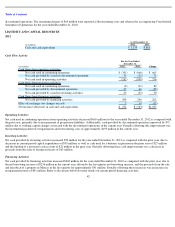
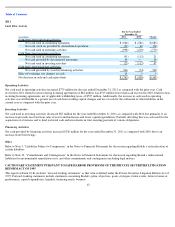
PERSONALIZED AND DOCUMENT IMAGING
Revenues
Current Year
The Personalized and Document Imaging Segment revenue decline of approximately 20% for the year ended December 31, 2012 was primarily
due to volume declines within Personalized Imaging largely due to reduced demand for paper and output systems (-8%) and consumer film (-
2%). Also contributing to the revenue decline was lower revenue within Intellectual Property (-9%) due to the $61 million license revenue
reduction reflecting sharing, with licensees, of the withholding tax refund received in the first quarter of 2012 (refer to Note 18, “Income Taxes”
for additional information). Partially offsetting these declines was favorable price/mix within Personalized Imaging (+2%), due to the results of
pricing actions in paper and output systems, and volume improvements for retail systems solutions (+2%) due to increased demand.
Prior Year
The Personalized and Document Imaging Segment revenue decline of approximately 32% for the year ended December 31, 2011 was primarily
attributable to a decrease in non-recurring intellectual property royalty revenues (-28%). Volume declines within Personalized Imaging (-3%),
driven by industry-related declines for film and paper, also contributed to the decline.
Gross Profit
Current Year
The decrease in gross profit percent for the year ended December 31, 2012 was attributable to lower margins within Intellectual Property (-7pp)
due to the $61 million licensing revenue reduction as noted above. Partially offsetting this decline
40
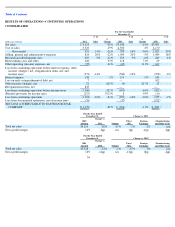
For the Year Ended
December 31,
(dollars in millions)
2012
% of
Sales
%
Change
2011
% of
Sales
%
Change
2010
% of
Sales
Total net sales
$
1,432
-
20
%
$
1,799
-
32
%
$
2,636
Cost of sales
1,146
-
14
%
1,337
-
1
%
1,356
Gross profit
286
20
%
-
38
%
462
26
%
-
64
%
1,280
49
%
Selling, general and administrative expenses
284
20
%
-
12
%
322
18
%
-
13
%
370
14
%
Research and development costs
58
4
%
-
11
%
65
4
%
-
16
%
77
3
%
(Loss) earnings from continuing operations before interest
expense, other income (charges), net and income taxes
$
(56
)
-
4
%
-
175
%
$
75
4
%
-
91
%
$
833
32
%
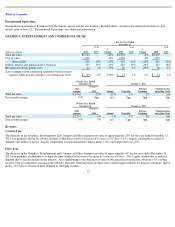
For the Year Ended
December 31,
Change vs. 2011
2012
Amount
Change vs.
2011
Volume
Price/
Mix
Foreign
Exchange
Manufacturing
and Other Costs
Total net sales
$
1,432
-
20
%
-
10
%
-
8
%
-
2
%
n/a
Gross profit margin
20
%
-
6pp
n/a
-
4pp
-
1pp
-
1pp
For the Year Ended
December 31,
Change vs. 2010
2011
Amount
Change vs.
2010
Volume
Price/
Mix
Foreign
Exchange
Manufacturing
and Other Costs
Total net sales
$
1,799
-
32
%
-
2
%
-
31
%
1
%
n/a
Gross profit margin
26
%
-
23pp
n/a
-
21pp
0pp
-
2pp