Kodak 2012 Annual Report Download - page 44
Download and view the complete annual report
Please find page 44 of the 2012 Kodak annual report below. You can navigate through the pages in the report by either clicking on the pages listed below, or by using the keyword search tool below to find specific information within the annual report.-
 1
1 -
2
-
3
-
4
-
5
-
6
-
7
-
8
-
9
-
10
-
11
-
12
-
13
-
14
-
15
-
16
-
17
-
18
-
19
-
20
-
21
-
22
-
23
-
24
-
25
-
26
-
27
-
28
-
29
-
30
-
31
-
32
-
33
-
 34
34 -
 35
35 -
 36
36 -
 37
37 -
 38
38 -
 39
39 -
 40
40 -
 41
41 -
 42
42 -
 43
43 -
 44
44 -
 45
45 -
 46
46 -
 47
47 -
 48
48 -
 49
49 -
 50
50 -
 51
51 -
 52
52 -
 53
53 -
 54
54 -
55
-
56
-
57
-
58
-
59
-
60
-
61
-
62
-
63
-
64
-
65
-
66
-
67
-
68
-
69
-
70
-
71
-
72
-
73
-
74
-
75
-
76
-
77
-
78
-
79
-
80
-
81
-
82
-
83
-
84
-
85
-
86
-
87
-
88
-
89
-
90
-
91
-
92
-
93
-
94
-
95
-
96
-
97
-
98
-
99
-
100
-
101
-
102
-
103
-
104
-
105
-
106
-
107
-
108
-
109
-
110
-
111
-
112
-
113
-
114
-
115
-
116
-
117
-
118
-
119
-
120
-
121
-
122
-
123
-
124
-
125
-
126
-
127
-
128
-
129
-
130
-
131
-
132
-
133
-
134
-
135
-
136
-
137
-
138
-
139
-
140
-
141
-
142
-
143
-
144
-
145
-
146
-
147
-
148
-
149
-
150
-
151
-
152
-
153
-
154
-
155
-
156
-
157
-
158
-
159
-
160
-
161
-
162
-
163
-
164
-
165
-
166
-
167
-
168
-
169
-
170
-
171
-
172
-
173
-
174
-
175
-
176
-
177
-
178
-
179
-
180
-
181
-
182
-
183
-
184
-
185
-
186
-
187
-
188
-
189
-
190
-
191
-
192
-
193
-
194
-
195
-
196
-
197
-
198
-
199
-
200
-
201
-
202
 |
 |

Table of Contents
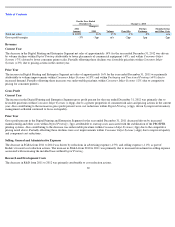
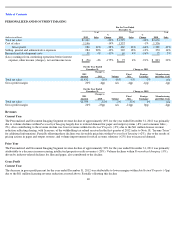
was favorable price/mix within Personalized Imaging (+4pp) driven by the pricing actions in paper and output systems noted above.
Prior Year
The decrease in gross profit percent for the year ended December 31, 2011 was primarily attributable to lower margins within Intellectual
Property
, driven by lower non-recurring intellectual property royalty revenues (-22pp). Also contributing to the decline were higher costs,
primarily related to silver (-3pp).
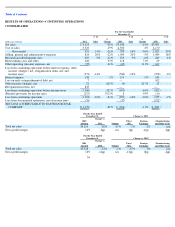
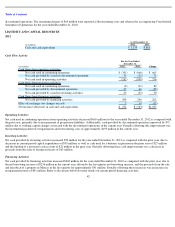
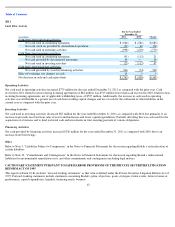
Selling, General and Administrative Expenses
The decreases in SG&A from 2011 to 2012 and 2010 to 2011 were primarily the result of cost reduction actions.
Research and Development Costs
The decreases in R&D from 2011 to 2012 and 2010 to 2011 were primarily attributable to cost reduction actions.
RESTRUCTURING COSTS AND OTHER
2012
Restructuring actions taken in 2012 were initiated to reduce Kodak’s cost structure as part of its commitment to drive sustainable profitability.
Actions included the winding down of sales of consumer inkjet printers, the digital capture and devices business exit, traditional product
manufacturing capacity reductions in the U.S. and Mexico, workforce reductions triggered by the Kodak Gallery wind-down, consolidation of
thermal media manufacturing in the U.S. and various targeted reductions in research and development, sales, service, and other administrative
functions.
As a result of these actions, Kodak recorded $271 million of charges during 2012, including $13 million of charges for accelerated depreciation
and $4 million of charges for inventory write-downs, which were reported in Cost of sales in the accompanying Consolidated Statement of
Operations for the year ended December 31, 2012, and $26 million which was reported as discontinued operations. The remaining $228 million
of charges were reported as Restructuring costs and other in the accompanying Consolidated Statement of Operations for the year ended
December 31, 2012.
During the year ended December 31, 2012, Kodak made cash payments related to restructuring of approximately $99 million.
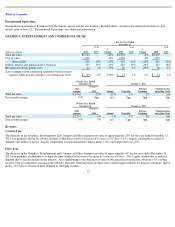
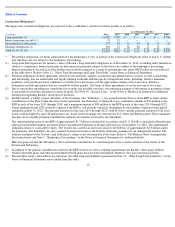
The charges of $271 million recorded in 2012 included $93 million applicable to the Digital Printing and Enterprise Segment, $20 million
applicable to the Graphics, Entertainment and Commercial Films Segment, $24 million applicable to the Personalized and Document Imaging
Segment, and $108 million that was applicable to manufacturing, research and development, and administrative functions, which are shared
across all segments. The remaining $26 million was applicable to discontinued operations.
The restructuring actions implemented in 2012 are expected to generate future annual cash savings of approximately $286 million. These savings
are expected to reduce future annual Cost of sales, SG&A, and R&D expenses by $116 million, $120 million, and $50 million, respectively.
Kodak began realizing a portion of these savings in 2012, and expects the majority of the annual savings to be in effect by the end of 2013 as
actions are completed.
2011
For the year ended December 31, 2011, Kodak incurred restructuring charges of $133 million. The $133 million of restructuring charges
included $10 million of costs related to accelerated depreciation and $2 million of charges for inventory write-downs, which were reported in
Cost of sales in the accompanying Consolidated Statement of Operations, and $3 million which was reported as discontinued operations. The
remaining charges of $118 million were reported as Restructuring costs and other in the accompanying Consolidated Statement of Operations for
the year ended December 31, 2011.
2010
For the year ended December 31, 2010, Kodak incurred restructuring charges of $78 million. The $78 million of restructuring charges included
$6 million of costs related to accelerated depreciation and $2 million of charges for inventory write-downs, which were reported in Cost of sales
in the accompanying Consolidated Statement of Operations, and $1 million which was reported as
41