Kodak 2012 Annual Report Download - page 116
Download and view the complete annual report
Please find page 116 of the 2012 Kodak annual report below. You can navigate through the pages in the report by either clicking on the pages listed below, or by using the keyword search tool below to find specific information within the annual report.-
 1
1 -
2
-
3
-
4
-
5
-
6
-
7
-
8
-
9
-
10
-
11
-
12
-
13
-
14
-
15
-
16
-
17
-
18
-
19
-
20
-
21
-
22
-
23
-
24
-
25
-
26
-
27
-
28
-
29
-
30
-
31
-
32
-
33
-
34
-
35
-
36
-
37
-
38
-
39
-
40
-
41
-
42
-
43
-
44
-
45
-
46
-
47
-
48
-
49
-
50
-
51
-
52
-
53
-
54
-
55
-
56
-
57
-
58
-
59
-
60
-
61
-
62
-
63
-
64
-
65
-
66
-
67
-
68
-
69
-
70
-
71
-
72
-
73
-
74
-
75
-
76
-
77
-
78
-
79
-
80
-
81
-
82
-
83
-
84
-
85
-
86
-
87
-
88
-
89
-
90
-
91
-
92
-
93
-
94
-
95
-
96
-
97
-
98
-
99
-
100
-
101
-
102
-
103
-
104
-
105
-
 106
106 -
 107
107 -
 108
108 -
 109
109 -
 110
110 -
 111
111 -
 112
112 -
 113
113 -
 114
114 -
 115
115 -
 116
116 -
 117
117 -
 118
118 -
 119
119 -
 120
120 -
 121
121 -
 122
122 -
 123
123 -
 124
124 -
 125
125 -
 126
126 -
127
-
128
-
129
-
130
-
131
-
132
-
133
-
134
-
135
-
136
-
137
-
138
-
139
-
140
-
141
-
142
-
143
-
144
-
145
-
146
-
147
-
148
-
149
-
150
-
151
-
152
-
153
-
154
-
155
-
156
-
157
-
158
-
159
-
160
-
161
-
162
-
163
-
164
-
165
-
166
-
167
-
168
-
169
-
170
-
171
-
172
-
173
-
174
-
175
-
176
-
177
-
178
-
179
-
180
-
181
-
182
-
183
-
184
-
185
-
186
-
187
-
188
-
189
-
190
-
191
-
192
-
193
-
194
-
195
-
196
-
197
-
198
-
199
-
200
-
201
-
202
 |
 |

Table of Contents
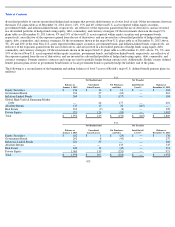
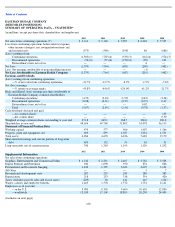
112
As of December 31,
(in millions)
2012
2011
2010
Segment total assets:
Graphics, Entertainment and Commercial Films
$
1,175
$
1,451
$
1,635
Digital Printing and Enterprise
493
549
525
Personalized and Document Imaging
934
1,301
1,622
Total of reportable segments
2,602
3,301
3,782
Cash and marketable securities
1,139
867
1,628
Net deferred income tax assets
545
510
815
All other/corporate items
—
—
1
Consolidated total assets
$
4,286
$
4,678
$
6,226
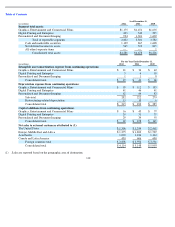
For the Year Ended December 31,
(in millions)
2012
2011
2010
Intangible asset amortization expense from continuing operations:
Graphics, Entertainment and Commercial Films
$
21
$
34
$
42
Digital Printing and Enterprise
5
6
10
Personalized and Document Imaging
1
1
8
Consolidated total
$
27
$
41
$
60
Depreciation expense from continuing operations:
Graphics, Entertainment and Commercial Films
$
99
$
112
$
155
Digital Printing and Enterprise
41
46
41
Personalized and Document Imaging
62
64
83
Sub
-
total
202
222
279
Restructuring
-
related depreciation
13
10
6
Consolidated total
$
215
$
232
$
285
Capital additions from continuing operations:
Graphics, Entertainment and Commercial Films
$
16
$
43
$
57
Digital Printing and Enterprise
24
51
37
Personalized and Document Imaging
29
34
55
Consolidated total
$
69
$
128
$
149
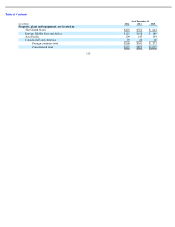
Net sales to external customers attributed to (1):
The United States
$
1,306
$
1,554
$
2,462
Europe, Middle East and Africa
$
1,375
$
1,802
$
1,787
Asia Pacific
1,003
1,186
1,144
Canada and Latin America
430
606
600
Foreign countries total
$
2,808
$
3,594
$
3,531
Consolidated total
$
4,114
$
5,148
$
5,993
(1)
Sales are reported based on the geographic area of destination.