Kodak 2012 Annual Report Download - page 107
Download and view the complete annual report
Please find page 107 of the 2012 Kodak annual report below. You can navigate through the pages in the report by either clicking on the pages listed below, or by using the keyword search tool below to find specific information within the annual report.-
 1
1 -
2
-
3
-
4
-
5
-
6
-
7
-
8
-
9
-
10
-
11
-
12
-
13
-
14
-
15
-
16
-
17
-
18
-
19
-
20
-
21
-
22
-
23
-
24
-
25
-
26
-
27
-
28
-
29
-
30
-
31
-
32
-
33
-
34
-
35
-
36
-
37
-
38
-
39
-
40
-
41
-
42
-
43
-
44
-
45
-
46
-
47
-
48
-
49
-
50
-
51
-
52
-
53
-
54
-
55
-
56
-
57
-
58
-
59
-
60
-
61
-
62
-
63
-
64
-
65
-
66
-
67
-
68
-
69
-
70
-
71
-
72
-
73
-
74
-
75
-
76
-
77
-
78
-
79
-
80
-
81
-
82
-
83
-
84
-
85
-
86
-
87
-
88
-
89
-
90
-
91
-
92
-
93
-
94
-
95
-
96
-
 97
97 -
 98
98 -
 99
99 -
 100
100 -
 101
101 -
 102
102 -
 103
103 -
 104
104 -
 105
105 -
 106
106 -
 107
107 -
 108
108 -
 109
109 -
 110
110 -
 111
111 -
 112
112 -
 113
113 -
 114
114 -
 115
115 -
 116
116 -
 117
117 -
118
-
119
-
120
-
121
-
122
-
123
-
124
-
125
-
126
-
127
-
128
-
129
-
130
-
131
-
132
-
133
-
134
-
135
-
136
-
137
-
138
-
139
-
140
-
141
-
142
-
143
-
144
-
145
-
146
-
147
-
148
-
149
-
150
-
151
-
152
-
153
-
154
-
155
-
156
-
157
-
158
-
159
-
160
-
161
-
162
-
163
-
164
-
165
-
166
-
167
-
168
-
169
-
170
-
171
-
172
-
173
-
174
-
175
-
176
-
177
-
178
-
179
-
180
-
181
-
182
-
183
-
184
-
185
-
186
-
187
-
188
-
189
-
190
-
191
-
192
-
193
-
194
-
195
-
196
-
197
-
198
-
199
-
200
-
201
-
202
 |
 |
Table of Contents
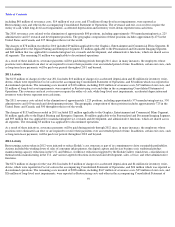
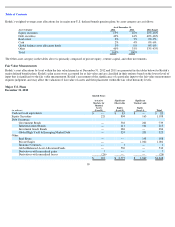
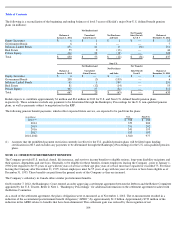
diversified portfolio of various uncorrelated hedge fund strategies that provide added returns at a lower level of risk. Of the investments shown in
the major U.S. plans table as of December 31, 2012 above, 11%, 15% and 4% of the total U.S. assets reported within equity securities,
government bonds, and inflation-linked bonds, respectively, are reflective of the exposures gained from the use of derivatives, and are invested
in a diversified portfolio of hedge funds using equity, debt, commodity, and currency strategies. Of the investments shown in the major U.S.
plans table as of December 31, 2011 above, 9% and 15% of the total U.S. assets reported within equity securities and government bonds,
respectively, are reflective of the exposures gained from the use of derivatives, and are invested in a diversified portfolio of hedge funds using
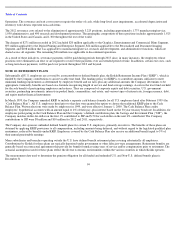
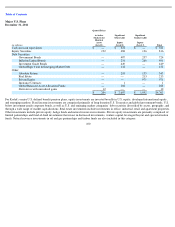
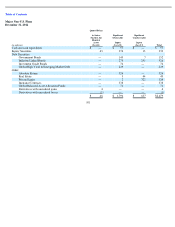
equity, debt, commodity, and currency strategies. Of the investments shown in the major Non-U.S. plans table as of December 31, 2012 above,
3%, 4% and 20% of the total Non-U.S. assets reported within equity securities, government bonds, and inflation-linked bonds, respectively, are
reflective of the exposures gained from the use of derivatives, and are invested in a diversified portfolio of hedge funds using equity, debt,
commodity, and currency strategies. Of the investments shown in the major Non-U.S. plans table as of December 31, 2011 above, 5%, 3%, and
19% of the total Non-U.S. assets reported within equity securities, government bonds, and inflation-linked bonds, respectively, are reflective of
the exposures gained from the use of derivatives, and are invested in a diversified portfolio of hedge funds using equity, debt, commodity, and
currency strategies. Foreign currency contracts and swaps are used to partially hedge foreign currency risk. Additionally, Kodak’s major defined
benefit pension plans invest in government bond futures or local government bonds to partially hedge the liability risk of the plans.
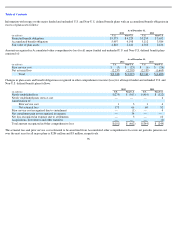
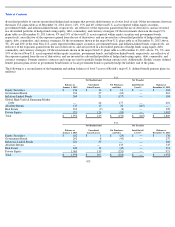
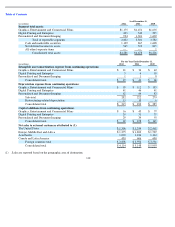
The following is a reconciliation of the beginning and ending balances of level 3 assets of Kodak’s major U.S. defined benefit pension plans (in
millions):
103
U.S.
Balance at
January 1, 2012
Net Realized and
Unrealized
Gains/(Losses)
Net Purchases
and Sales
Net Transfer
Into/(Out of)
Level 3
Balance at
December 31, 2012
Equity Securities
$
136
$
16
$
11
$
—
$
163
Government Bonds
231
27
(63
)
—
201
Inflation
-
Linked Bonds
260
21
(177
)
—
104
Global High Yield & Emerging Market
Debt
—
24
177
—
201
Absolute Return
135
10
20
(165
)
—
Real Estate
213
(9
)
(6
)
—
198
Private Equity
971
126
(95
)
—
1,002
Total
$
1,952
$
215
$
(133
)
$
(165
)
$
1,869
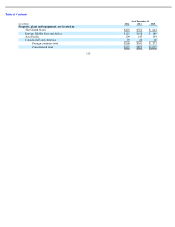
U.S.
Balance at
January 1, 2011
Net Realized and
Unrealized
Gains/(Losses)
Net Purchases
and Sales
Net Transfer
Into/(Out of)
Level 3
Balance at
December 31, 2011
Equity Securities
$
162
$
3
$
(29
)
$
—
$
136
Government Bonds
292
8
(43
)
—
237
Inflations
-
Linked Bonds
221
39
—
—
260
Absolute Return
—
—
135
—
135
Real Estate
240
18
(45
)
—
213
Private Equity
1,063
139
(231
)
—
971
Total
$
1,978
$
207
$
(233
)
$
—
$
1,952