Kodak 2012 Annual Report Download - page 40
Download and view the complete annual report
Please find page 40 of the 2012 Kodak annual report below. You can navigate through the pages in the report by either clicking on the pages listed below, or by using the keyword search tool below to find specific information within the annual report.-
 1
1 -
2
-
3
-
4
-
5
-
6
-
7
-
8
-
9
-
10
-
11
-
12
-
13
-
14
-
15
-
16
-
17
-
18
-
19
-
20
-
21
-
22
-
23
-
24
-
25
-
26
-
27
-
28
-
29
-
 30
30 -
 31
31 -
 32
32 -
 33
33 -
 34
34 -
 35
35 -
 36
36 -
 37
37 -
 38
38 -
 39
39 -
 40
40 -
 41
41 -
 42
42 -
 43
43 -
 44
44 -
 45
45 -
 46
46 -
 47
47 -
 48
48 -
 49
49 -
 50
50 -
51
-
52
-
53
-
54
-
55
-
56
-
57
-
58
-
59
-
60
-
61
-
62
-
63
-
64
-
65
-
66
-
67
-
68
-
69
-
70
-
71
-
72
-
73
-
74
-
75
-
76
-
77
-
78
-
79
-
80
-
81
-
82
-
83
-
84
-
85
-
86
-
87
-
88
-
89
-
90
-
91
-
92
-
93
-
94
-
95
-
96
-
97
-
98
-
99
-
100
-
101
-
102
-
103
-
104
-
105
-
106
-
107
-
108
-
109
-
110
-
111
-
112
-
113
-
114
-
115
-
116
-
117
-
118
-
119
-
120
-
121
-
122
-
123
-
124
-
125
-
126
-
127
-
128
-
129
-
130
-
131
-
132
-
133
-
134
-
135
-
136
-
137
-
138
-
139
-
140
-
141
-
142
-
143
-
144
-
145
-
146
-
147
-
148
-
149
-
150
-
151
-
152
-
153
-
154
-
155
-
156
-
157
-
158
-
159
-
160
-
161
-
162
-
163
-
164
-
165
-
166
-
167
-
168
-
169
-
170
-
171
-
172
-
173
-
174
-
175
-
176
-
177
-
178
-
179
-
180
-
181
-
182
-
183
-
184
-
185
-
186
-
187
-
188
-
189
-
190
-
191
-
192
-
193
-
194
-
195
-
196
-
197
-
198
-
199
-
200
-
201
-
202
 |
 |

Table of Contents
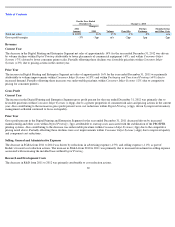
Discontinued Operations
Discontinued operations of Kodak include the digital capture and devices business, Kodak Gallery, and other miscellaneous businesses. For
details, refer to Note 25, “Discontinued Operations” for additional information.
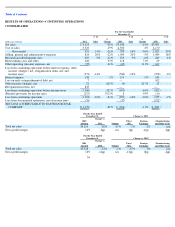
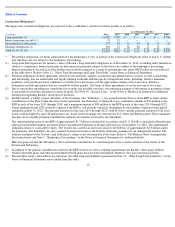
GRAPHICS, ENTERTAINMENT AND COMMERCIAL FILMS
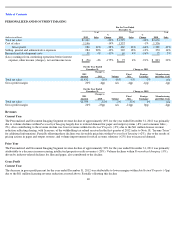
Revenues
Current Year
The decrease in the Graphics, Entertainment and Commercial Films Segment net sales of approximately 23% for the year ended December 31,
2012 was primarily driven by volume declines within Entertainment Imaging & Commercial Films (-11%), largely attributable to reduced
demand, and within Graphics , largely attributable to lower demand for digital plates (-3%) and output devices (-2%).
Prior Year
The decrease in the Graphics, Entertainment and Commercial Films Segment net sales of approximately 6% for the year ended December 31,
2011 was primarily attributable to volume declines within Entertainment Imaging & Commercial Films (-7%), largely attributable to reduced
demand due to secular decline in the industry. Also contributing to the decline was unfavorable price/mix for prepress solutions (-3%) within
Graphics due to competitive pricing in the industry. Partially offsetting these declines were volume improvements for prepress solutions’ digital
plates (+2%) due to increased print demand in emerging markets.
37
For the Year Ended
December 31,
(dollars in millions)
2012
% of
Sales
%
Change
2011
% of
Sales
%
Change
2010
% of
Sales
Total net sales
$
1,742
-
23
%
$
2,251
-
6
%
$
2,407
Cost of sales
1,476
-
19
%
1,828
-
3
%
1,875
Gross profit
266
15
%
-
37
%
423
19
%
-
20
%
532
22
%
Selling, general and administrative expenses
255
15
%
-
25
%
342
15
%
-
20
%
427
18
%
Research and development costs
44
3
%
-
35
%
68
3
%
-
25
%
91
4
%
(Loss) earnings from continuing operations before interest
expense, other income (charges), net and income taxes
$
(33
)
-
2
%
-
354
%
$
13
1
%
-
7
%
$
14
1
%
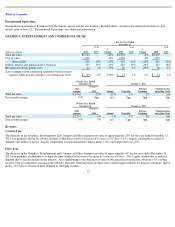
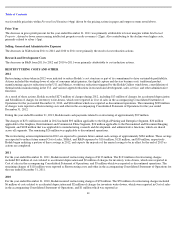
For the Year Ended
December 31,
Change vs. 2011
2012
Amount
Change vs.
2011
Volume
Price/Mix
Foreign
Exchange
Manufacturing
and Other Costs
Total net sales
$
1,742
-
23
%
-
19
%
-
2
%
-
2
%
n/a
Gross profit margin
15
%
-
4pp
n/a
-
2pp
0pp
-
2pp
For the Year Ended
December 31,
Change vs. 2010
2011
Amount
Change vs.
2010
Volume
Price/Mix
Foreign
Exchange
Manufacturing
and Other Costs
Total net sales
$
2,251
-
6
%
-
6
%
-
3
%
3
%
n/a
Gross profit margin
19
%
-
3
%
n/a
-
1pp
0pp
-
2pp