Kodak 2012 Annual Report Download - page 124
Download and view the complete annual report
Please find page 124 of the 2012 Kodak annual report below. You can navigate through the pages in the report by either clicking on the pages listed below, or by using the keyword search tool below to find specific information within the annual report.-
 1
1 -
2
-
3
-
4
-
5
-
6
-
7
-
8
-
9
-
10
-
11
-
12
-
13
-
14
-
15
-
16
-
17
-
18
-
19
-
20
-
21
-
22
-
23
-
24
-
25
-
26
-
27
-
28
-
29
-
30
-
31
-
32
-
33
-
34
-
35
-
36
-
37
-
38
-
39
-
40
-
41
-
42
-
43
-
44
-
45
-
46
-
47
-
48
-
49
-
50
-
51
-
52
-
53
-
54
-
55
-
56
-
57
-
58
-
59
-
60
-
61
-
62
-
63
-
64
-
65
-
66
-
67
-
68
-
69
-
70
-
71
-
72
-
73
-
74
-
75
-
76
-
77
-
78
-
79
-
80
-
81
-
82
-
83
-
84
-
85
-
86
-
87
-
88
-
89
-
90
-
91
-
92
-
93
-
94
-
95
-
96
-
97
-
98
-
99
-
100
-
101
-
102
-
103
-
104
-
105
-
106
-
107
-
108
-
109
-
110
-
111
-
112
-
113
-
 114
114 -
 115
115 -
 116
116 -
 117
117 -
 118
118 -
 119
119 -
 120
120 -
 121
121 -
 122
122 -
 123
123 -
 124
124 -
 125
125 -
 126
126 -
 127
127 -
 128
128 -
 129
129 -
 130
130 -
 131
131 -
 132
132 -
 133
133 -
 134
134 -
135
-
136
-
137
-
138
-
139
-
140
-
141
-
142
-
143
-
144
-
145
-
146
-
147
-
148
-
149
-
150
-
151
-
152
-
153
-
154
-
155
-
156
-
157
-
158
-
159
-
160
-
161
-
162
-
163
-
164
-
165
-
166
-
167
-
168
-
169
-
170
-
171
-
172
-
173
-
174
-
175
-
176
-
177
-
178
-
179
-
180
-
181
-
182
-
183
-
184
-
185
-
186
-
187
-
188
-
189
-
190
-
191
-
192
-
193
-
194
-
195
-
196
-
197
-
198
-
199
-
200
-
201
-
202
 |
 |

Table of Contents
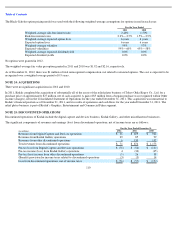
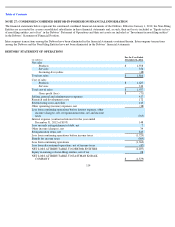
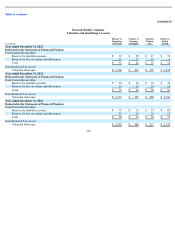
EASTMAN KODAK COMPANY
(DEBTOR-IN-POSSESSION)
SUMMARY OF OPERATING DATA – UNAUDITED*
(in millions, except per share data, shareholders, and employees)
(footnotes on next page)
120
2012
2011
2010
2009
2008
Net sales from continuing operations (7)
$
4,114
$
5,148
$
5,993
$
6,248
$
7,535
Loss from continuing operations before interest expense,
other income (charges), net, reorganization items, net,
and income taxes
(573
)
(540
)
(198
)
86
(686
)
(Loss) earnings from:
Continuing operations
(1,303
)(1)
(707
)(2)
(535
)(3)
(116
)(4)
(574
)(5)
Discontinued operations
(76
)(6)
(57
)(6)
(152
)(6)
(99
)
132
Extraordinary item, net of tax
—
—
—
6
—
Net Loss
(1,379
)
(764
)
(687
)
(209
)
(442
)
Less: Net earnings attributable to noncontrolling interests
—
—
—
(
1
)
—
Net Loss Attributable to Eastman Kodak Company
(1,379
)
(764
)
(687
)
(210
)
(442
)
Earnings and Dividends
(Loss) earnings from continuing operations
—
%
of net sales from continuing operations
-
31.7
%
-
13.7
%
-
8.9
%
-
1.9
%
-
7.6
%
Net (loss) earnings
—
%
return on average equity
-
45.8
%
-
44.6
%
-
124.0
%
-
41.2
%
-
21.7
%
Basic and diluted (loss) earnings per share attributable to
Eastman Kodak Company common shareholders:
Continuing operations
(4.79
)
(2.63
)
(1.99
)
(0.43
)
(2.04
)
Discontinued operations
(0.28
)
(0.21
)
(0.57
)
(0.37
)
0.47
Extraordinary item, net of tax
—
—
—
0.02
—
Total
(5.07
)
(2.84
)
(2.56
)
(0.78
)
(1.57
)
Cash dividends declared and paid
—
on common shares
—
—
—
—
139
—
per comon share
—
—
—
—
0.50
Weighted average common shares outstanding at year end
271.8
269.1
268.5
268.0
281.8
Shareholders at year end
48,656
49,760
51,802
54,078
56,115
Statement of Financial Position Data
Working capital
474
577
966
1,407
1,566
Property, plant and equipment, net
693
895
1,037
1,254
1,551
Total assets
4,286
4,678
6,226
7,682
9,179
Short-term borrowings and current portion of long-term
debt
699
152
50
62
51
Long
-
term debt, net of current portion
740
1,363
1,195
1,129
1,252
2012
2011
2010
2009
2008
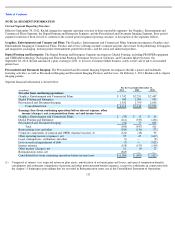
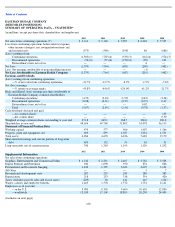
Supplemental Information
Net sales from continuing operations
Graphics, Entertainment and Commercial Films
$
1,742
$
2,251
$
2,407
$
2,782
$
3,508
Digital Printing and Enterprise
940
1,098
950
854
886
Personalized and Document Imaging
1,432
1,799
2,636
2,607
3,134
All Other
—
—
—
5
7
Research and development costs
207
235
249
280
383
Depreciation
218
253
318
354
420
Taxes (excludes payroll, sales and excise taxes)
(229
)
38
142
145
(121
)
Wages, salaries and employee benefits
1,465
1,578
1,572
1,732
2,141
Employees as of year end
—
in the U.S.
5,980
8,350
9,600
10,630
12,800
—
worldwide
13,100
17,100
18,800
20,250
24,400