Kodak 2012 Annual Report Download - page 125
Download and view the complete annual report
Please find page 125 of the 2012 Kodak annual report below. You can navigate through the pages in the report by either clicking on the pages listed below, or by using the keyword search tool below to find specific information within the annual report.-
 1
1 -
2
-
3
-
4
-
5
-
6
-
7
-
8
-
9
-
10
-
11
-
12
-
13
-
14
-
15
-
16
-
17
-
18
-
19
-
20
-
21
-
22
-
23
-
24
-
25
-
26
-
27
-
28
-
29
-
30
-
31
-
32
-
33
-
34
-
35
-
36
-
37
-
38
-
39
-
40
-
41
-
42
-
43
-
44
-
45
-
46
-
47
-
48
-
49
-
50
-
51
-
52
-
53
-
54
-
55
-
56
-
57
-
58
-
59
-
60
-
61
-
62
-
63
-
64
-
65
-
66
-
67
-
68
-
69
-
70
-
71
-
72
-
73
-
74
-
75
-
76
-
77
-
78
-
79
-
80
-
81
-
82
-
83
-
84
-
85
-
86
-
87
-
88
-
89
-
90
-
91
-
92
-
93
-
94
-
95
-
96
-
97
-
98
-
99
-
100
-
101
-
102
-
103
-
104
-
105
-
106
-
107
-
108
-
109
-
110
-
111
-
112
-
113
-
114
-
 115
115 -
 116
116 -
 117
117 -
 118
118 -
 119
119 -
 120
120 -
 121
121 -
 122
122 -
 123
123 -
 124
124 -
 125
125 -
 126
126 -
 127
127 -
 128
128 -
 129
129 -
 130
130 -
 131
131 -
 132
132 -
 133
133 -
 134
134 -
 135
135 -
136
-
137
-
138
-
139
-
140
-
141
-
142
-
143
-
144
-
145
-
146
-
147
-
148
-
149
-
150
-
151
-
152
-
153
-
154
-
155
-
156
-
157
-
158
-
159
-
160
-
161
-
162
-
163
-
164
-
165
-
166
-
167
-
168
-
169
-
170
-
171
-
172
-
173
-
174
-
175
-
176
-
177
-
178
-
179
-
180
-
181
-
182
-
183
-
184
-
185
-
186
-
187
-
188
-
189
-
190
-
191
-
192
-
193
-
194
-
195
-
196
-
197
-
198
-
199
-
200
-
201
-
202
 |
 |

Table of Contents
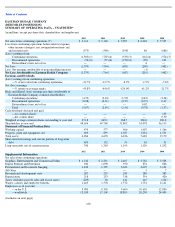
EASTMAN KODAK COMPANY
(DEBTOR-IN-POSSESSION)
SUMMARY OF OPERATING DATA
(footnotes for previous page)
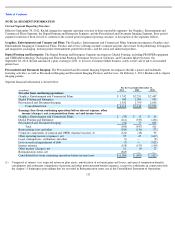
Corporate components of pension and OPEB include cost, expected return on plan assets, amortization of actuarial gains and losses, and special
termination benefits, curtailments and settlement components of pension and other postretirement benefit expenses, except for settlement in
connection with the chapter 11 bankruptcy proceedings that are recorded in Reorganization items, net in the Consolidated Statement of
Operations.
121
*
Historical results are not indicative of future results.
(1) Includes impairment charges of $2 million; pre-tax restructuring charges of $245 million; $843 million in pre-
tax reorganization items, net;
$62 million of income related to gains on assets sales; $35 million associated with the termination of a supply agreement; corporate
components of pension and OPEB costs of $122 million; $4 million of income related to reversals of value-added tax reserves; and a net
benefit of $320 million related to discrete tax items. These items increased net loss from continuing operations by $912 million.
(2) Includes pre-tax goodwill and other impairment charges of $13 million; pre-tax restructuring charges of $130 million; $78 million of
income related to gains and assets sales; corporate components of pension and OPEB costs of $28 million; $3 million of income related to
reversals of value-added tax reserves; and a net benefit of $38 million related to discrete tax items. These items increased net loss from
continuing operations by $31 million.
(3) Includes a pre-tax goodwill impairment charge of $626 million; pre-tax restructuring charges of $77 million; a $102 million loss on early
extinguishment of debt; $8 million of income related to gains on assets sales; $19 million of income related to legal contingencies and
settlements; $6 million of charges related to foreign contingencies; and a net benefit of $109 million related to discrete tax items. These
items increased net loss from continuing operations by $698 million.
(4) Includes pre-tax restructuring and rationalization charges of $245 million; a $5 million charge related to a legal settlement; $100 million of
income related to gains on asset sales; $7 million of income related to the reversal of negative goodwill; $10 million of income related to
reversals of value-added tax reserves; and a $6 million asset impairment charge. These items increased net loss from continuing operations
by $131 million.
(5) Includes a pre-tax goodwill impairment charge of $785 million; pre-tax restructuring and rationalization charges of $149 million, net of
reversals; $22 million of income related to gains on sales of assets and businesses; $3 million of charges related to asset impairments; $41
million of charges for legal contingencies and settlements; $10 million of charges for support of an educational institution; $94 million of
income related to postemployment benefit plans; $3 million of income for a foreign export contingency; $270 million of income related to
an IRS refund; and charges of $27 million related to discrete tax items. These items increased net loss from continuing operations by $611
million.
(6) Refer to Note 25, “Discontinued Operations” in the Notes to Financial Statements for a discussion regarding the earnings from
discontinued operations.
(7) Includes revenues from non-recurring intellectual property licensing agreements of $(61) million in 2012, $82 million in 2011, $838
million in 2010, $435 million in 2009, and $227 million in 2008.