Kodak 2012 Annual Report Download - page 104
Download and view the complete annual report
Please find page 104 of the 2012 Kodak annual report below. You can navigate through the pages in the report by either clicking on the pages listed below, or by using the keyword search tool below to find specific information within the annual report.-
 1
1 -
2
-
3
-
4
-
5
-
6
-
7
-
8
-
9
-
10
-
11
-
12
-
13
-
14
-
15
-
16
-
17
-
18
-
19
-
20
-
21
-
22
-
23
-
24
-
25
-
26
-
27
-
28
-
29
-
30
-
31
-
32
-
33
-
34
-
35
-
36
-
37
-
38
-
39
-
40
-
41
-
42
-
43
-
44
-
45
-
46
-
47
-
48
-
49
-
50
-
51
-
52
-
53
-
54
-
55
-
56
-
57
-
58
-
59
-
60
-
61
-
62
-
63
-
64
-
65
-
66
-
67
-
68
-
69
-
70
-
71
-
72
-
73
-
74
-
75
-
76
-
77
-
78
-
79
-
80
-
81
-
82
-
83
-
84
-
85
-
86
-
87
-
88
-
89
-
90
-
91
-
92
-
93
-
 94
94 -
 95
95 -
 96
96 -
 97
97 -
 98
98 -
 99
99 -
 100
100 -
 101
101 -
 102
102 -
 103
103 -
 104
104 -
 105
105 -
 106
106 -
 107
107 -
 108
108 -
 109
109 -
 110
110 -
 111
111 -
 112
112 -
 113
113 -
 114
114 -
115
-
116
-
117
-
118
-
119
-
120
-
121
-
122
-
123
-
124
-
125
-
126
-
127
-
128
-
129
-
130
-
131
-
132
-
133
-
134
-
135
-
136
-
137
-
138
-
139
-
140
-
141
-
142
-
143
-
144
-
145
-
146
-
147
-
148
-
149
-
150
-
151
-
152
-
153
-
154
-
155
-
156
-
157
-
158
-
159
-
160
-
161
-
162
-
163
-
164
-
165
-
166
-
167
-
168
-
169
-
170
-
171
-
172
-
173
-
174
-
175
-
176
-
177
-
178
-
179
-
180
-
181
-
182
-
183
-
184
-
185
-
186
-
187
-
188
-
189
-
190
-
191
-
192
-
193
-
194
-
195
-
196
-
197
-
198
-
199
-
200
-
201
-
202
 |
 |

Table of Contents
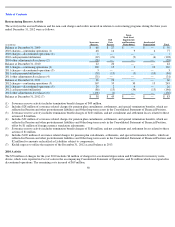
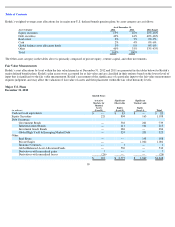
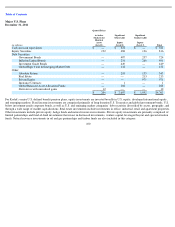
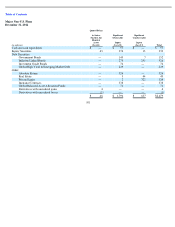
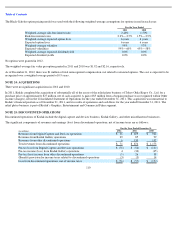
Major U.S. Plans
December 31, 2011
For Kodak’s major U.S. defined benefit pension plans, equity investments are invested broadly in U.S. equity, developed international equity,
and emerging markets. Fixed income investments are comprised primarily of long duration U.S. Treasuries and global government bonds, U.S.
below investment-grade corporate bonds, as well as U.S. and emerging market companies’ debt securities diversified by sector, geography, and
through a wide range of market capitalizations. Real estate investments include investments in office, industrial, retail and apartment properties.
Other investments include private equity, hedge funds and natural resource investments. Private equity investments are primarily comprised of
limited partnerships and fund-of-fund investments that invest in distressed investments, venture capital, leveraged buyout and special situation
funds. Natural resource investments in oil and gas partnerships and timber funds are also included in this category.
100
(in millions)
Quoted Prices
in Active
Markets for
Identical
Assets
(Level 1)
Significant
Observable
Inputs
(Level 2)
Significant
Unobservable
Inputs
(Level 3)
Total
Cash and cash equivalents
$
—
$
321
$
—
$
321
Equity Securities
192
488
136
816
Debt Securities:
Government Bonds
—
487
237
724
Inflation
-
Linked Bonds
—
231
260
491
Investment Grade Bonds
—
449
—
449
Global High Yield & Emerging Market Debt
—
132
—
132
Other:
Absolute Return
—
210
135
345
Real Estate
—
—
213
213
Private Equity
—
—
971
971
Insurance Contracts
—
1
—
1
Global Balanced Asset Allocation Funds
—
288
—
288
Derivatives with unrealized gains
12
—
—
12
$
204
$
2,607
$
1,952
$
4,763