Kodak 2012 Annual Report Download - page 45
Download and view the complete annual report
Please find page 45 of the 2012 Kodak annual report below. You can navigate through the pages in the report by either clicking on the pages listed below, or by using the keyword search tool below to find specific information within the annual report.-
 1
1 -
2
-
3
-
4
-
5
-
6
-
7
-
8
-
9
-
10
-
11
-
12
-
13
-
14
-
15
-
16
-
17
-
18
-
19
-
20
-
21
-
22
-
23
-
24
-
25
-
26
-
27
-
28
-
29
-
30
-
31
-
32
-
33
-
34
-
 35
35 -
 36
36 -
 37
37 -
 38
38 -
 39
39 -
 40
40 -
 41
41 -
 42
42 -
 43
43 -
 44
44 -
 45
45 -
 46
46 -
 47
47 -
 48
48 -
 49
49 -
 50
50 -
 51
51 -
 52
52 -
 53
53 -
 54
54 -
 55
55 -
56
-
57
-
58
-
59
-
60
-
61
-
62
-
63
-
64
-
65
-
66
-
67
-
68
-
69
-
70
-
71
-
72
-
73
-
74
-
75
-
76
-
77
-
78
-
79
-
80
-
81
-
82
-
83
-
84
-
85
-
86
-
87
-
88
-
89
-
90
-
91
-
92
-
93
-
94
-
95
-
96
-
97
-
98
-
99
-
100
-
101
-
102
-
103
-
104
-
105
-
106
-
107
-
108
-
109
-
110
-
111
-
112
-
113
-
114
-
115
-
116
-
117
-
118
-
119
-
120
-
121
-
122
-
123
-
124
-
125
-
126
-
127
-
128
-
129
-
130
-
131
-
132
-
133
-
134
-
135
-
136
-
137
-
138
-
139
-
140
-
141
-
142
-
143
-
144
-
145
-
146
-
147
-
148
-
149
-
150
-
151
-
152
-
153
-
154
-
155
-
156
-
157
-
158
-
159
-
160
-
161
-
162
-
163
-
164
-
165
-
166
-
167
-
168
-
169
-
170
-
171
-
172
-
173
-
174
-
175
-
176
-
177
-
178
-
179
-
180
-
181
-
182
-
183
-
184
-
185
-
186
-
187
-
188
-
189
-
190
-
191
-
192
-
193
-
194
-
195
-
196
-
197
-
198
-
199
-
200
-
201
-
202
 |
 |

Table of Contents
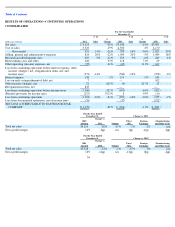
discontinued operations. The remaining charges of $69 million were reported as Restructuring costs and other in the accompanying Consolidated
Statement of Operations for the year ended December 31, 2010.
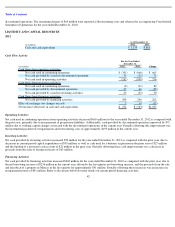
LIQUIDITY AND CAPITAL RESOURCES
2012
Cash Flow Activity
Operating Activities
Net cash used in continuing operations from operating activities decreased $665 million for the year ended December 31, 2012 as compared with
the prior year, primarily due to non-payment of pre-petition liabilities. Additionally, cash provided by discontinued operations improved by $71
million due to working capital changes associated with the discontinued operations in the current year. Partially offsetting this improvement was
the incremental payment of reorganization and restructuring costs of approximately $195 million in the current year.
Investing Activities
Net cash provided by investing activities increased $50 million for the year ended December 31, 2012 as compared with the prior year, due to
decreases in current period capital expenditures of $59 million, as well as cash used for a business acquisition in the prior year of $27 million
and the funding of a restricted cash account of $22 million in the prior year. Partially offsetting these cash improvements was a decrease in
proceeds from the sales of businesses/assets of $63 million.
Financing Activities
Net cash provided by financing activities increased $262 million for the year ended December 31, 2012 as compared with the prior year, due to
the net borrowing increase of $256 million in the current year, driven by the first quarter net borrowing increase, and the proceeds from the sale
and leaseback of a property in Mexico in the first quarter for approximately $41 million. Partially offsetting these increases was an increase in
reorganization items of $41 million. Refer to discussion below for more details on current period financing activities.
42
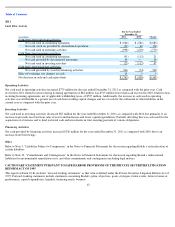
As of December 31,
(in millions)
2012
2011
Cash and cash equivalents
$
1,135
$
861
For the Year Ended
December 31,
(in millions)
2012
2011
Change
Cash flows from operating activities:
Net cash used in continuing operations
$
(301
)
$
(966
)
$
665
Net cash provided by (used in) discontinued operations
39
(32
)
71
Net cash used in operating activities
(262
)
(998
)
736
Cash flows from investing activities:
Net cash used in continuing operations
(2
)
(91
)
89
Net cash provided by discontinued operations
27
66
(39
)
Net cash provided by (used in) investing activities
25
(25
)
50
Cash flows from financing activities:
Net cash provided by financing activities
508
246
262
Effect of exchange rate changes on cash
3
14
(11
)
Net increase (decrease) in cash and cash equivalents
$
274
$
(763
)
$
1,037