Kodak 2012 Annual Report Download - page 195
Download and view the complete annual report
Please find page 195 of the 2012 Kodak annual report below. You can navigate through the pages in the report by either clicking on the pages listed below, or by using the keyword search tool below to find specific information within the annual report.-
 1
1 -
2
-
3
-
4
-
5
-
6
-
7
-
8
-
9
-
10
-
11
-
12
-
13
-
14
-
15
-
16
-
17
-
18
-
19
-
20
-
21
-
22
-
23
-
24
-
25
-
26
-
27
-
28
-
29
-
30
-
31
-
32
-
33
-
34
-
35
-
36
-
37
-
38
-
39
-
40
-
41
-
42
-
43
-
44
-
45
-
46
-
47
-
48
-
49
-
50
-
51
-
52
-
53
-
54
-
55
-
56
-
57
-
58
-
59
-
60
-
61
-
62
-
63
-
64
-
65
-
66
-
67
-
68
-
69
-
70
-
71
-
72
-
73
-
74
-
75
-
76
-
77
-
78
-
79
-
80
-
81
-
82
-
83
-
84
-
85
-
86
-
87
-
88
-
89
-
90
-
91
-
92
-
93
-
94
-
95
-
96
-
97
-
98
-
99
-
100
-
101
-
102
-
103
-
104
-
105
-
106
-
107
-
108
-
109
-
110
-
111
-
112
-
113
-
114
-
115
-
116
-
117
-
118
-
119
-
120
-
121
-
122
-
123
-
124
-
125
-
126
-
127
-
128
-
129
-
130
-
131
-
132
-
133
-
134
-
135
-
136
-
137
-
138
-
139
-
140
-
141
-
142
-
143
-
144
-
145
-
146
-
147
-
148
-
149
-
150
-
151
-
152
-
153
-
154
-
155
-
156
-
157
-
158
-
159
-
160
-
161
-
162
-
163
-
164
-
165
-
166
-
167
-
168
-
169
-
170
-
171
-
172
-
173
-
174
-
175
-
176
-
177
-
178
-
179
-
180
-
181
-
182
-
183
-
184
-
 185
185 -
 186
186 -
 187
187 -
 188
188 -
 189
189 -
 190
190 -
 191
191 -
 192
192 -
 193
193 -
 194
194 -
 195
195 -
 196
196 -
 197
197 -
 198
198 -
 199
199 -
 200
200 -
 201
201 -
 202
202
 |
 |
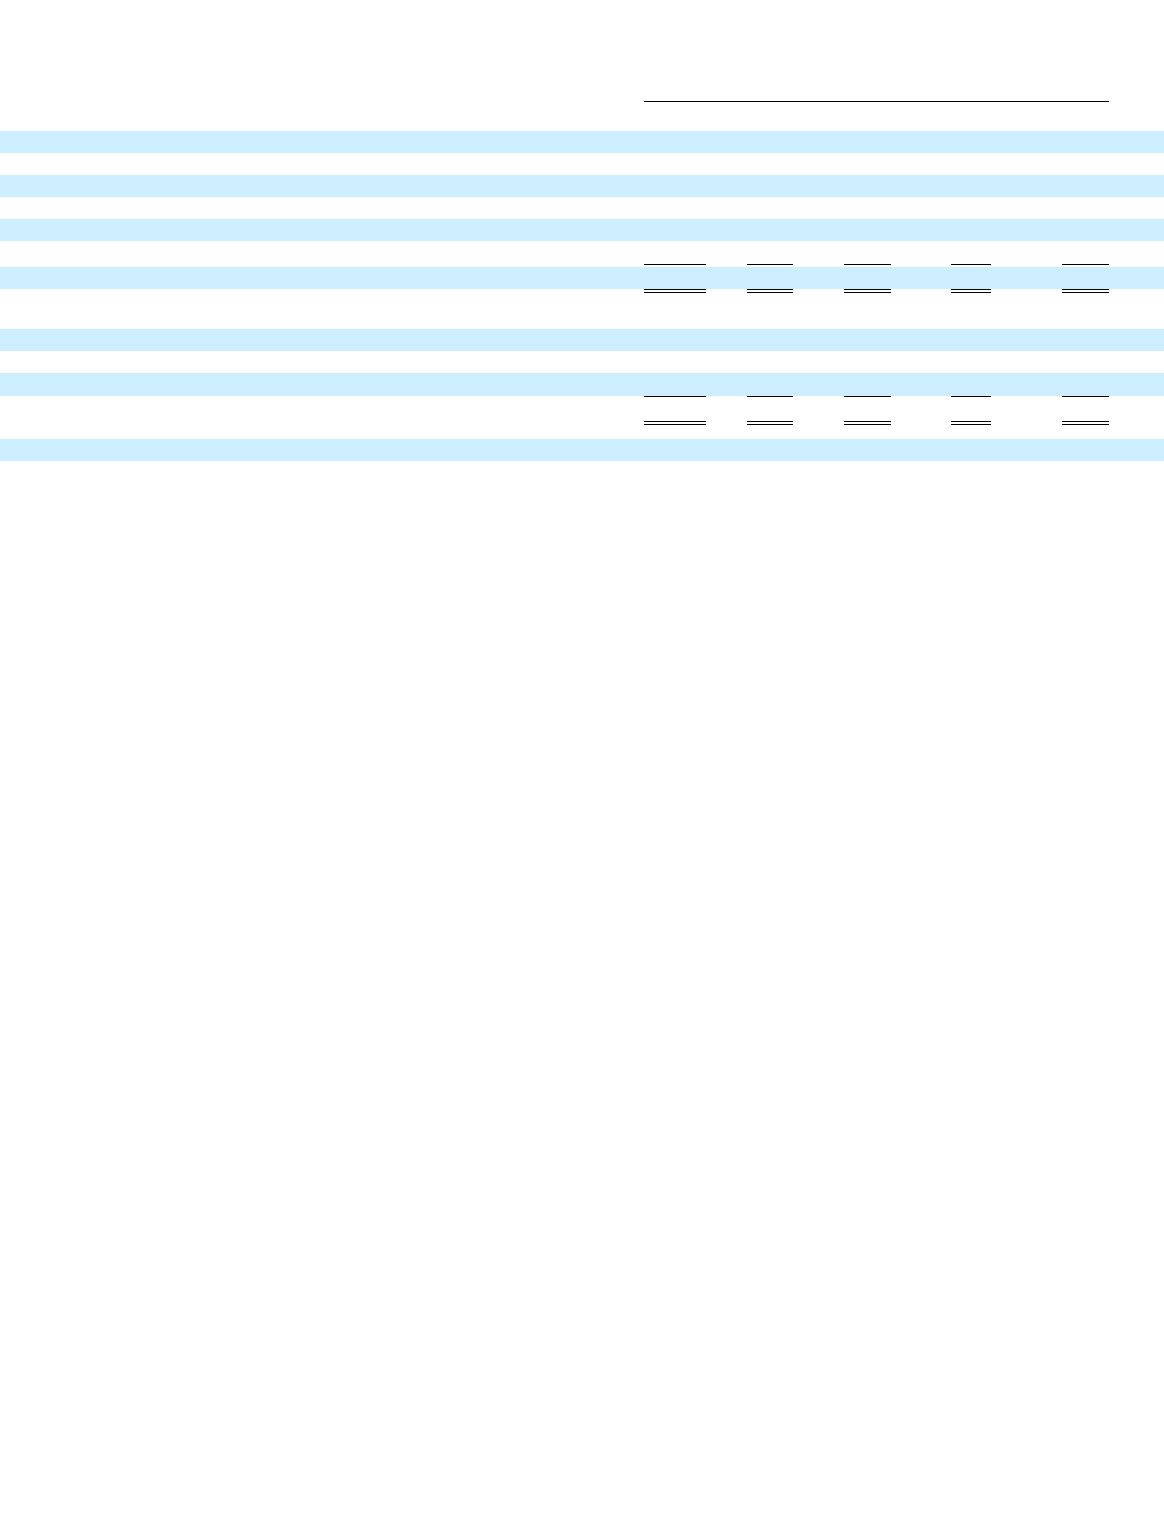
Exhibit (12)
COMPUTATION OF RATIO OF EARNINGS TO FIXED CHARGES
Year Ended December 31
(in millions)
2012
2011
2010
2009
2008
Loss from continuing operations before provision for income taxes
$
(1,560
)
$
(699
)
$
(425
)
$
(5
)
$
(738
)
Adjustments:
Undistributed (earnings) loss of equity method investees
—
—
—
—
—
Interest expense
158
155
148
118
107
Interest component of rental expense (1)
23
29
32
36
39
Amortization of capitalized interest
2
2
2
2
2
Earnings as adjusted
$
(1,377
)
$
(513
)
$
(243
)
$
151
$
(590
)
Fixed charges:
Interest expense
158
155
148
118
107
Interest component of rental expense (1)
23
29
32
36
39
Capitalized interest
1
1
1
2
3
Total fixed charges
$
182
$
185
$
181
$
156
$
149
Ratio of earnings to fixed charges
*
**
***
****
*****
(1) Interest component of rental expense is estimated to equal 1/3 of such expense, which is considered a reasonable approximation of the
interest factor.
*
Earnings for the year ended December 31, 2012 were inadequate to cover fixed charges. The coverage deficiency was $1559 million.
**
Earnings for the year ended December 31, 2011 were inadequate to cover fixed charges. The coverage deficiency was $698 million.
***
Earnings for the year ended December 31, 2010 were inadequate to cover fixed charges. The coverage deficiency was $424 million.
****
Earnings for the year ended December 31, 2009 were inadequate
to cover fixed charges. The coverage deficiency was $5 million.
*****
Earnings for the year ended December 31, 2008 were inadequate to cover fixed charges. The coverage deficiency was $739 million.