IHOP 2011 Annual Report Download - page 95
Download and view the complete annual report
Please find page 95 of the 2011 IHOP annual report below. You can navigate through the pages in the report by either clicking on the pages listed below, or by using the keyword search tool below to find specific information within the annual report.-
 1
1 -
2
-
3
-
4
-
5
-
6
-
7
-
8
-
9
-
10
-
11
-
12
-
13
-
14
-
15
-
16
-
17
-
18
-
19
-
20
-
21
-
22
-
23
-
24
-
25
-
26
-
27
-
28
-
29
-
30
-
31
-
32
-
33
-
34
-
35
-
36
-
37
-
38
-
39
-
40
-
41
-
42
-
43
-
44
-
45
-
46
-
47
-
48
-
49
-
50
-
51
-
52
-
53
-
54
-
55
-
56
-
57
-
58
-
59
-
60
-
61
-
62
-
63
-
64
-
65
-
66
-
67
-
68
-
69
-
70
-
71
-
72
-
73
-
74
-
75
-
76
-
77
-
78
-
79
-
80
-
81
-
82
-
83
-
84
-
 85
85 -
 86
86 -
 87
87 -
 88
88 -
 89
89 -
 90
90 -
 91
91 -
 92
92 -
 93
93 -
 94
94 -
 95
95 -
 96
96 -
 97
97 -
 98
98 -
 99
99 -
 100
100 -
 101
101 -
 102
102 -
 103
103 -
 104
104 -
 105
105 -
106
-
107
-
108
-
109
-
110
-
111
-
112
-
113
-
114
-
115
-
116
-
117
-
118
-
119
-
120
-
121
-
122
-
123
-
124
-
125
-
126
-
127
-
128
-
129
-
130
-
131
-
132
-
133
-
134
-
135
-
136
-
137
-
138
-
139
-
140
-
141
-
142
 |
 |

DineEquity, Inc. and Subsidiaries
Notes to the Consolidated Financial Statements (Continued)
6. Goodwill (Continued)
77
franchising units exceeded their respective carrying values and the Company concluded there was no impairment of goodwill.
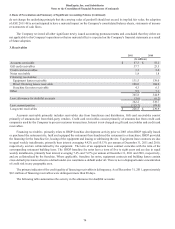
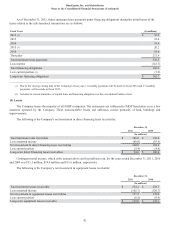
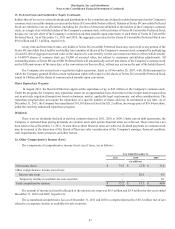
7. Other Intangible Assets
As of December 31, 2011 and 2010, intangible assets were as follows:
Balance, December 31, 2008
Amortization expense
Impairment
Other
Balance, December 31, 2009
Amortization expense
Impairment
Refranchising
Other
Balance, December 31, 2010
Amortization expense
Refranchising
Other
Balance, December 31, 2011
Not Subject to Amortization
Tradename
(In millions)
$ 745.9
—
(93.5)
—
652.4
—
—
—
—
652.4
—
—
—
$ 652.4
Liquor
Licenses
$ 2.9
—
—
—
2.9
—
(0.3)
—
—
2.6
—
(1.1)
—
$ 1.5
Other
$ —
—
—
0.2
0.2
—
—
—
0.1
0.3
—
—
0.2
$ 0.5
Subject to Amortization
Franchising
Rights
$ 189.5
(10.0)
—
—
179.5
(10.0)
—
(0.2)
—
169.3
(10.0)
—
—
$ 159.3
Recipes and
Menus
$ 13.5
(2.3)
—
—
11.2
(2.3)
—
—
—
8.9
(2.3)
—
—
$ 6.6
Leaseholds
$ 4.2
(1.1)
—
0.3
3.4
(1.0)
—
(1.2)
1.2
2.4
(0.6)
0.3
—
$ 2.1
Total
$ 956.0
(13.4)
(93.5)
0.5
849.6
(13.3)
(0.3)
(1.4)
1.3
835.9
(12.9)
(0.8)
0.2
$ 822.4
See Note 17, Impairment and Closure Charges, regarding the impairment of the tradename recognized in 2009.
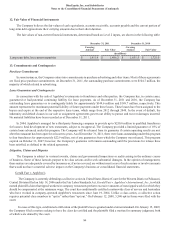
Annual amortization expense for next five fiscal years is estimated to be approximately $11.7 million per year. The weighted
average life of the intangible assets subject to amortization is 18.9 and 18.7 years at December 31, 2011 and 2010, respectively.
Gross and net carrying amounts of intangible assets subject to amortization at December 31, 2011 and 2010 are as follows:
Franchising rights
Recipes and menus
Leaseholds/other
Total
December 31, 2011
Gross
(In millions)
$ 200.4
15.7
4.7
$ 220.8
Accumulated
Amortization
$ (41.1)
(9.1)
(2.6)
$ (52.8)
Net
$ 159.3
6.6
2.1
$ 168.0
December 31, 2010
Gross
$ 200.4
15.7
5.6
$ 221.7
Accumulated
Amortization
$ (31.1)
(6.8)
(3.2)
$ (41.1)
Net
$ 169.3
8.9
2.4
$ 180.6
8. Debt
Debt consists of the following components:
Senior Secured Credit Facility, due October 2017, at a variable interest rate of 4.25% and
6.0% as of December 31, 2011 and 2010, respectively
Senior Notes due October 2018, at a fixed rate of 9.5%
Discount
Total debt
Less current maturities
Long-term debt
2011
(In millions)
$ 682.5
765.8
(29.5)
1,418.8
(7.4)
$ 1,411.4
2010
$ 844.0
825.0
(28.5)
1,640.5
(9.0)
$ 1,631.5