IHOP 2011 Annual Report Download - page 124
Download and view the complete annual report
Please find page 124 of the 2011 IHOP annual report below. You can navigate through the pages in the report by either clicking on the pages listed below, or by using the keyword search tool below to find specific information within the annual report.-
 1
1 -
2
-
3
-
4
-
5
-
6
-
7
-
8
-
9
-
10
-
11
-
12
-
13
-
14
-
15
-
16
-
17
-
18
-
19
-
20
-
21
-
22
-
23
-
24
-
25
-
26
-
27
-
28
-
29
-
30
-
31
-
32
-
33
-
34
-
35
-
36
-
37
-
38
-
39
-
40
-
41
-
42
-
43
-
44
-
45
-
46
-
47
-
48
-
49
-
50
-
51
-
52
-
53
-
54
-
55
-
56
-
57
-
58
-
59
-
60
-
61
-
62
-
63
-
64
-
65
-
66
-
67
-
68
-
69
-
70
-
71
-
72
-
73
-
74
-
75
-
76
-
77
-
78
-
79
-
80
-
81
-
82
-
83
-
84
-
85
-
86
-
87
-
88
-
89
-
90
-
91
-
92
-
93
-
94
-
95
-
96
-
97
-
98
-
99
-
100
-
101
-
102
-
103
-
104
-
105
-
106
-
107
-
108
-
109
-
110
-
111
-
112
-
113
-
 114
114 -
 115
115 -
 116
116 -
 117
117 -
 118
118 -
 119
119 -
 120
120 -
 121
121 -
 122
122 -
 123
123 -
 124
124 -
 125
125 -
 126
126 -
 127
127 -
 128
128 -
 129
129 -
 130
130 -
 131
131 -
 132
132 -
 133
133 -
 134
134 -
135
-
136
-
137
-
138
-
139
-
140
-
141
-
142
 |
 |
DineEquity, Inc. and Subsidiaries
Notes to the Consolidated Financial Statements (Continued)
106
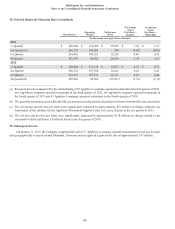
24. Selected Quarterly Financial Data (Unaudited)
2011
1st Quarter
2nd Quarter (c)
3rd Quarter
4th Quarter
2010
1st Quarter
2nd Quarter
3rd Quarter
4th Quarter(d)
Revenues(a)
(In thousands, except per share amounts)
$ 300,200
268,338
264,481
242,179
$ 358,064
340,136
335,515
299,926
Operating
Margin
$ 110,769
100,285
100,553
96,022
$ 115,136
107,398
107,573
99,694
Net Income
(Loss)
$ 29,699
348
16,525
28,620
$ 19,671
14,041
14,331
(50,831)
Net Income
(Loss)
Per Share—
Basic(b)
$ 1.59
(0.02)
0.86
1.55
$ 0.75
0.43
0.45
(3.33)
Net Income
(Loss)
Per Share—
Diluted(b)
$ 1.53
(0.02)
0.85
1.51
$ 0.75
0.42
0.44
(3.33)
________________________________
(a) Revenues have been impacted by the refranchising of 65 Applebee's company-operated restaurants in the first quarter of 2011,
one Applebee's company-operated restaurants in the third quarter of 2011, 66 Applebee's company-operated restaurants in
the fourth quarter of 2011 and 83 Applebee's company-operated restaurants in the fourth quarter of 2010.
(b) The quarterly amounts may not add to the full year amount as each quarterly calculation is discrete from the full-year calculation.
(c) The net income and net loss per share were significantly impacted by approximately $21 million of charges related to the
termination of the sublease for the Applebee's Restaurant Support Center in Lenexa, Kansas in the 2nd quarter of 2011.
(d) The net loss and net loss per share were significantly impacted by approximately $110 million of charges related to the
retirement of debt and Series A Preferred Stock in the 4th quarter of 2010.
25. Subsequent Events
On January 11, 2012, the Company completed the sale of 17 Applebee's company-operated restaurants located in a six-state
area geographically centered around Memphis, Tennessee and recognized a gain on the sale of approximately $17 million.