IHOP 2011 Annual Report Download - page 64
Download and view the complete annual report
Please find page 64 of the 2011 IHOP annual report below. You can navigate through the pages in the report by either clicking on the pages listed below, or by using the keyword search tool below to find specific information within the annual report.-
 1
1 -
2
-
3
-
4
-
5
-
6
-
7
-
8
-
9
-
10
-
11
-
12
-
13
-
14
-
15
-
16
-
17
-
18
-
19
-
20
-
21
-
22
-
23
-
24
-
25
-
26
-
27
-
28
-
29
-
30
-
31
-
32
-
33
-
34
-
35
-
36
-
37
-
38
-
39
-
40
-
41
-
42
-
43
-
44
-
45
-
46
-
47
-
48
-
49
-
50
-
51
-
52
-
53
-
 54
54 -
 55
55 -
 56
56 -
 57
57 -
 58
58 -
 59
59 -
 60
60 -
 61
61 -
 62
62 -
 63
63 -
 64
64 -
 65
65 -
 66
66 -
 67
67 -
 68
68 -
 69
69 -
 70
70 -
 71
71 -
 72
72 -
 73
73 -
 74
74 -
75
-
76
-
77
-
78
-
79
-
80
-
81
-
82
-
83
-
84
-
85
-
86
-
87
-
88
-
89
-
90
-
91
-
92
-
93
-
94
-
95
-
96
-
97
-
98
-
99
-
100
-
101
-
102
-
103
-
104
-
105
-
106
-
107
-
108
-
109
-
110
-
111
-
112
-
113
-
114
-
115
-
116
-
117
-
118
-
119
-
120
-
121
-
122
-
123
-
124
-
125
-
126
-
127
-
128
-
129
-
130
-
131
-
132
-
133
-
134
-
135
-
136
-
137
-
138
-
139
-
140
-
141
-
142
 |
 |

46
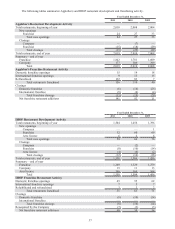
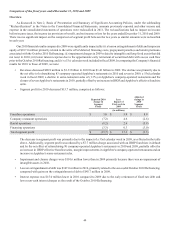
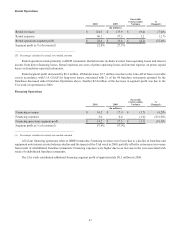
Company Restaurant Operations
Company restaurant sales
Company restaurant expenses
Company restaurant segment profit
Segment profit as % of revenue(1)
2010
(In millions)
$ 815.6
699.3
$ 116.3
14.3%
2009
$ 890.0
766.5
$ 123.5
13.9%
Favorable
(Unfavorable)
Variance
$(74.4)
67.2
$(7.2)
%
Change(1)
(8.4)%
8.8 %
(5.9)%
_________________________________________
(1) Percentages calculated on actual, not rounded, amounts
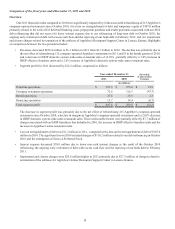
As of December 31, 2010, Company restaurant operations were comprised of 309 Applebee's company-operated restaurants
and 11 IHOP company-operated restaurants. The impact of the IHOP restaurants on all comparisons of fiscal 2010 with the same
period of 2009 was negligible.
Company restaurant sales declined $74.4 million. Applebee's company restaurant sales declined $74.1 million, of which
$38.0 million was due to the refranchising of 83 company-operated restaurants in the fourth quarter of 2010 and seven restaurants
during 2009 and $20.7 million was due to the addition of a 53rd week of operations in the prior year. A decrease in domestic same-
restaurant sales of 1.3% and the closure of seven restaurants in 2010 were responsible for the rest of the decline. The change in
same-restaurant sales was driven mainly by a decline in guest traffic that was partially offset by a slightly higher average guest
check. The higher average guest check is primarily the result of an increase of approximately 1.7% in menu pricing and favorable
product mix changes. We believe the decline in comparable guest traffic is reflective of the current adverse economic conditions
affecting customers and impacting the restaurant industry as a whole.
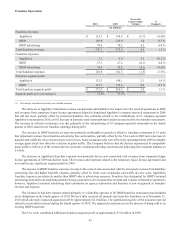
Company restaurant expenses declined $67.2 million. Applebee's company restaurant expenses declined $66.4 million due
to the refranchising of 83 restaurants in the fourth quarter of 2010, the impact of the 53rd week in 2009 and the closure of seven
company operated restaurants. Operating margin for Applebee's company restaurant operations improved to 14.8% for 2010 from
14.4% for the same period of last year, as shown below:
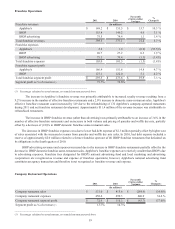
Restaurant Expenses as Percentage of Restaurant Sales (Applebee's)
Food and beverage
Labor
Direct and occupancy
Total Company restaurant expenses(a)
2010
25.5%
33.2%
26.6%
85.3%
2009
26.2%
33.3%
26.1%
85.6%
Favorable
(Unfavorable)
Variance
0.7 %
0.1 %
(0.5)%
0.4 %
_________________________________________
(a) Percentages may not add due to rounding.
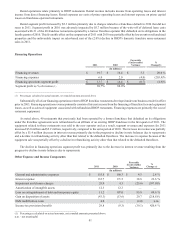
Margins across all cost categories were favorably impacted 1.6% due to menu price increases and promotional and product
mix changes. Labor and direct and occupancy margins were unfavorably affected by approximately 1.0% by the impact of guest
traffic declines on fixed cost components. Other margin changes in specific cost categories were as follows:
• Food and beverage costs as a percentage of company restaurant sales decreased 0.3% primarily due to lower commodity
cost (primarily poultry and oil) and improvement in waste reduction.
• Labor costs as a percentage of restaurant sales decreased 0.1% due to improvements in hourly labor productivity, partially
offset by higher group insurance cost.
• Direct and occupancy costs as a percentage of company restaurant sales increased 0.5% due to increases in facility
expenses for property and liability insurance and repair and maintenance, higher national gift card program cost and
credit card fees, and the 53rd week in 2009.
The 53rd week contributed additional company restaurant segment profit of approximately $4.6 million for Applebee's in
2009.