IHOP 2011 Annual Report Download - page 112
Download and view the complete annual report
Please find page 112 of the 2011 IHOP annual report below. You can navigate through the pages in the report by either clicking on the pages listed below, or by using the keyword search tool below to find specific information within the annual report.-
 1
1 -
2
-
3
-
4
-
5
-
6
-
7
-
8
-
9
-
10
-
11
-
12
-
13
-
14
-
15
-
16
-
17
-
18
-
19
-
20
-
21
-
22
-
23
-
24
-
25
-
26
-
27
-
28
-
29
-
30
-
31
-
32
-
33
-
34
-
35
-
36
-
37
-
38
-
39
-
40
-
41
-
42
-
43
-
44
-
45
-
46
-
47
-
48
-
49
-
50
-
51
-
52
-
53
-
54
-
55
-
56
-
57
-
58
-
59
-
60
-
61
-
62
-
63
-
64
-
65
-
66
-
67
-
68
-
69
-
70
-
71
-
72
-
73
-
74
-
75
-
76
-
77
-
78
-
79
-
80
-
81
-
82
-
83
-
84
-
85
-
86
-
87
-
88
-
89
-
90
-
91
-
92
-
93
-
94
-
95
-
96
-
97
-
98
-
99
-
100
-
101
-
 102
102 -
 103
103 -
 104
104 -
 105
105 -
 106
106 -
 107
107 -
 108
108 -
 109
109 -
 110
110 -
 111
111 -
 112
112 -
 113
113 -
 114
114 -
 115
115 -
 116
116 -
 117
117 -
 118
118 -
 119
119 -
 120
120 -
 121
121 -
 122
122 -
123
-
124
-
125
-
126
-
127
-
128
-
129
-
130
-
131
-
132
-
133
-
134
-
135
-
136
-
137
-
138
-
139
-
140
-
141
-
142
 |
 |

DineEquity, Inc. and Subsidiaries
Notes to the Consolidated Financial Statements (Continued)
94
Unrecognized tax benefit as of December 31, 2009
Change as a result of prior year tax positions
Change as a result of current year tax positions
Decreases relating to settlements with taxing authorities
Decreases as a result of a lapse of the statute of limitations
Unrecognized tax benefit as of December 31, 2010
Change as a result of prior year tax positions
Change as a result of current year tax positions
Decreases relating to settlements with taxing authorities
Decreases as a result of a lapse of the statute of limitations
Unrecognized tax benefit as of December 31, 2011
(in millions)
$ 11.0
7.7
—
(5.6)
(0.3)
12.8
(3.3)
—
(0.8)
(0.5)
$ 8.2
As of December 31, 2011, the accrued interest and penalties were $3.0 million and $0.3 million, respectively, excluding any
related income tax benefits. As of December 31, 2010, the accrued interest and penalties were $8.9 million and $0.5 million,
respectively, excluding any related income tax benefits. The decrease of $5.9 million of accrued interest is primarily related to the
release of liabilities for unrecognized tax benefits surrounding gift card income deferral as a result of the issuance of new guidance
by the U.S. Internal Revenue Service, partially offset by the accrual of interest on the remaining liability for unrecognized tax
benefits during the twelve months ended December 31, 2011. The Company recognizes interest accrued related to unrecognized
tax benefits and penalties as a component of income tax expense which is recognized in the Consolidated Statements of Operations.
The Company has various state net operating loss carryovers representing $3.4 million of state taxes. The net operating loss
carryovers will expire, if unused, during the period from 2012 through 2030.
For the years ended December 31, 2011 and 2010, the Company had a total valuation allowance in the amounts of $2.9
million and $9.6 million, respectively. Of the total $2.9 million in 2011, $1.2 million is related to the Massachusetts enacted
legislation requiring unitary businesses to file combined reports and $1.7 million is related to various state net operating loss
carryovers for DineEquity, Inc. and International House of Pancakes, LLC and Subsidiaries.
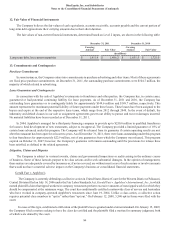
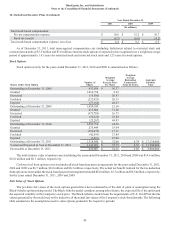
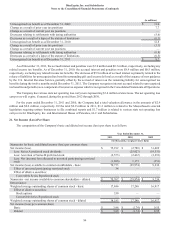
21. Net Income (Loss) Per Share
The computation of the Company's basic and diluted net income (loss) per share is as follows:
Numerator for basic and diluted income (loss) per common share:
Net income (loss)
Less: Series A preferred stock dividends
Less: Accretion of Series B preferred stock
Less: Net (income) loss allocated to unvested participating restricted
stock
Net income (loss) available to common stockholders - basic
Effect of unvested participating restricted stock
Effect of dilutive securities:
Convertible Series B preferred stock
Numerator - net income available to common shareholders - diluted
Denominator:
Weighted average outstanding shares of common stock - basic
Effect of dilutive securities:
Stock options
Convertible Series B preferred stock
Weighted average outstanding shares of common stock - diluted
Net income (loss) per common share:
Basic
Diluted
Year Ended December 31,
2011
(In thousands, except per share data)
$ 75,192
—
(2,573)
(1,886)
70,733
34
—
$ 70,767
17,846
339
—
18,185
$ 3.96
$ 3.89
2010
$ (2,788)
(25,927)
(2,432)
1,173
(29,974)
—
—
$ (29,974)
17,240
—
—
17,240
$ (1.74)
$ (1.74)
2009
$ 31,409
(19,531)
(2,291)
(351)
9,236
—
—
$ 9,236
16,917
—
—
16,917
$ 0.55
$ 0.55