IHOP 2011 Annual Report Download - page 42
Download and view the complete annual report
Please find page 42 of the 2011 IHOP annual report below. You can navigate through the pages in the report by either clicking on the pages listed below, or by using the keyword search tool below to find specific information within the annual report.-
 1
1 -
2
-
3
-
4
-
5
-
6
-
7
-
8
-
9
-
10
-
11
-
12
-
13
-
14
-
15
-
16
-
17
-
18
-
19
-
20
-
21
-
22
-
23
-
24
-
25
-
26
-
27
-
28
-
29
-
30
-
31
-
 32
32 -
 33
33 -
 34
34 -
 35
35 -
 36
36 -
 37
37 -
 38
38 -
 39
39 -
 40
40 -
 41
41 -
 42
42 -
 43
43 -
 44
44 -
 45
45 -
 46
46 -
 47
47 -
 48
48 -
 49
49 -
 50
50 -
 51
51 -
 52
52 -
53
-
54
-
55
-
56
-
57
-
58
-
59
-
60
-
61
-
62
-
63
-
64
-
65
-
66
-
67
-
68
-
69
-
70
-
71
-
72
-
73
-
74
-
75
-
76
-
77
-
78
-
79
-
80
-
81
-
82
-
83
-
84
-
85
-
86
-
87
-
88
-
89
-
90
-
91
-
92
-
93
-
94
-
95
-
96
-
97
-
98
-
99
-
100
-
101
-
102
-
103
-
104
-
105
-
106
-
107
-
108
-
109
-
110
-
111
-
112
-
113
-
114
-
115
-
116
-
117
-
118
-
119
-
120
-
121
-
122
-
123
-
124
-
125
-
126
-
127
-
128
-
129
-
130
-
131
-
132
-
133
-
134
-
135
-
136
-
137
-
138
-
139
-
140
-
141
-
142
 |
 |

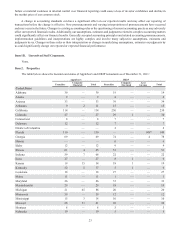
24
Applebee's
Franchise Company-
Operated Total
IHOP
Franchise Company-
Operated
Area
License Total
Nevada
New Hampshire
New Jersey
New Mexico
New York
North Carolina
North Dakota
Ohio
Oklahoma
Oregon
Pennsylvania
Rhode Island
South Carolina
South Dakota
Tennessee
Texas
Utah
Vermont
Virginia
Washington
West Virginia
Wisconsin
Wyoming
Total Domestic
International
Brazil
Canada
Chile
Costa Rica
Greece
Guatemala
Honduras
Jordan
Kuwait
Lebanon
Mexico
Puerto Rico
Qatar
Saudi Arabia
Singapore
St. Croix, Virgin Islands
United Arab Emirates
Total International
Totals
14
14
56
18
110
56
11
95
21
21
76
8
40
6
34
95
16
3
36
40
17
44
5
1,694
12
25
3
1
2
3
7
1
5
2
64
2
5
12
1
—
3
148
1,842
—
—
—
—
—
2
—
—
—
—
—
—
—
—
4
—
—
—
37
—
—
—
—
177
—
—
—
—
—
—
—
—
—
—
—
—
—
—
—
—
—
—
177
14
14
56
18
110
58
11
95
21
21
76
8
40
6
38
95
16
3
73
40
17
44
5
1,871
12
25
3
1
2
3
7
1
5
2
64
2
5
12
1
—
3
148
2,019
23
4
40
17
51
45
2
22
27
7
19
3
27
5
34
186
19
1
59
30
6
10
3
1,346
—
5
—
—
—
2
—
—
—
—
13
2
—
—
—
1
—
23
1,369
—
—
—
—
—
—
—
9
—
—
—
—
—
—
—
—
—
—
—
—
—
2
—
15
—
—
—
—
—
—
—
—
—
—
—
—
—
—
—
—
—
—
15
—
—
—
—
—
—
—
—
—
—
—
—
—
—
—
—
—
—
—
—
—
—
—
153
—
13
—
—
—
—
—
—
—
—
—
—
—
—
—
—
—
13
166
*
23
4
40
17
51
45
2
31
27
7
19
3
27
5
34
186
19
1
59
30
6
12
3
1,514
—
18
—
—
—
2
—
—
—
—
13
2
—
—
—
1
—
36
1,550
* of these restaurants 70 in Florida and nine in Canada have been sub-licensed by the area licensee