IHOP 2011 Annual Report Download - page 6
Download and view the complete annual report
Please find page 6 of the 2011 IHOP annual report below. You can navigate through the pages in the report by either clicking on the pages listed below, or by using the keyword search tool below to find specific information within the annual report.-
 1
1 -
 2
2 -
 3
3 -
 4
4 -
 5
5 -
 6
6 -
 7
7 -
 8
8 -
 9
9 -
 10
10 -
 11
11 -
 12
12 -
 13
13 -
 14
14 -
 15
15 -
 16
16 -
 17
17 -
18
-
19
-
20
-
21
-
22
-
23
-
24
-
25
-
26
-
27
-
28
-
29
-
30
-
31
-
32
-
33
-
34
-
35
-
36
-
37
-
38
-
39
-
40
-
41
-
42
-
43
-
44
-
45
-
46
-
47
-
48
-
49
-
50
-
51
-
52
-
53
-
54
-
55
-
56
-
57
-
58
-
59
-
60
-
61
-
62
-
63
-
64
-
65
-
66
-
67
-
68
-
69
-
70
-
71
-
72
-
73
-
74
-
75
-
76
-
77
-
78
-
79
-
80
-
81
-
82
-
83
-
84
-
85
-
86
-
87
-
88
-
89
-
90
-
91
-
92
-
93
-
94
-
95
-
96
-
97
-
98
-
99
-
100
-
101
-
102
-
103
-
104
-
105
-
106
-
107
-
108
-
109
-
110
-
111
-
112
-
113
-
114
-
115
-
116
-
117
-
118
-
119
-
120
-
121
-
122
-
123
-
124
-
125
-
126
-
127
-
128
-
129
-
130
-
131
-
132
-
133
-
134
-
135
-
136
-
137
-
138
-
139
-
140
-
141
-
142
 |
 |

We find this tremendously exciting, and we’ll be
investing in our ability to further collaborate
with franchisees.
We are invigorating our brands.
When it comes to brand revitalization, we employ
a proven methodology that engages guests across
a variety of touch points. At IHOP, we’re working to
boost performance by upgrading existing brand
elements, while introducing fresh new experiences.
In 2011, we launched IHOP at Home®, a selection of
signature products available to consumers in their
grocery aisles. We’ve also increased the distribution
outlets selling IHOP gift cards to more than 70,000.
Franchise development at IHOP remains on track,
with 58 new restaurants opened worldwide in 2011.
We are taking measures to improve operations
and energize the IHOP brand with more effective
marketing, stronger value propositions and enhanced
menu offerings. By combining signature promotions
through a new featured menu system at key times
during the year, we will provide exciting new menu
offerings that are unique to the IHOP brand. We
are supporting this with a program of service and
value initiatives that are designed to improve the
guest experience, build relevance and improve this
iconic brand’s same-restaurant sales.
At Applebee’s, our brand revitalization strategy is
taking hold in a visible way, with the launch of an
ambitious remodel program. Combined with new
openings, 31% of our domestic restaurants now
showcase the new look. Franchisees are embracing
the remodel, guests are responding favorably to the
changes and restaurant performance is improving.
We are implementing a number of strategic marketing
and operational initiatives at Applebee’s to drive traffic
across all day parts. This includes a robust pipeline of
items launched in 2011 that deliver enhanced value
and variety to help augment our $1 billion and growing
alcoholic and non-alcoholic beverage business. In
the fourth quarter of 2011, we continued to expand
Applebee’s significant retail gift card sales, adding
1,760 Target locations around the country to our more
than 80,000 distribution outlets, which include
Wal-Mart and other major retailers.
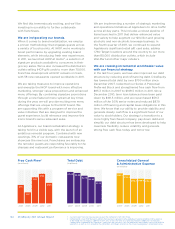
We are creating incremental stockholder value
with our financial strategy.
In the last four years, we have also improved our debt
structure by reducing and refinancing debt. DineEquity
has lowered total debt by over $700 million since
December 2007, redeemed our Series A Perpetual
Preferred Stock and strengthened free cash flow from
$95.3 million in 2007 to $108.5 million in 2011. Since
December 2010, term loan balances have been paid
down by $161.5 million, and we repurchased $59.3
million of the 9.5% senior notes and reduced $87.9
million of financing and capital lease obligations in this
time. We know that our ability to provide stability and
generate steady cash flow is a significant facet of our
value to stockholders. Our strategy to transition to a
more highly franchised company, pay down debt and
simplify our debt structure has been developed to help
maximize flexibility, reduce volatility and generate
strong free cash flow, today and tomorrow.
Free Cash Flow1
(in millions)
Total Debt
(in billions)
Consolidated General
& Administrative Expense
(in millions)
1 See non-GAAP financial measures disclosure in the Company’s Form 10-K filing.
2 Comprised of actual IHOP General & Administrative expense plus pro forma Applebee’s General & Administrative expense
as disclosed in the Company’s 2007 Form 10-K, less certain one-time costs primarily related to additional stock-based
compensation triggered by the Applebee’s acquisition and severance costs for employees terminated in connection with the
acquisition, as well as costs related to the exploration of strategic alternatives for enhancing Applebee’s shareholder value.
20112007 2008 2009 2010
$108
$95
$57
$135
$153
20112007 2008 2009 2010
$1.73
$2.44 $2.36
$2.14 $2.03
2011200722008 2009 2010
$155.8
$193.4
$182.2
$158.5 $159.6
04 DineEquity 2011 Annual Report