IHOP 2011 Annual Report Download - page 101
Download and view the complete annual report
Please find page 101 of the 2011 IHOP annual report below. You can navigate through the pages in the report by either clicking on the pages listed below, or by using the keyword search tool below to find specific information within the annual report.-
 1
1 -
2
-
3
-
4
-
5
-
6
-
7
-
8
-
9
-
10
-
11
-
12
-
13
-
14
-
15
-
16
-
17
-
18
-
19
-
20
-
21
-
22
-
23
-
24
-
25
-
26
-
27
-
28
-
29
-
30
-
31
-
32
-
33
-
34
-
35
-
36
-
37
-
38
-
39
-
40
-
41
-
42
-
43
-
44
-
45
-
46
-
47
-
48
-
49
-
50
-
51
-
52
-
53
-
54
-
55
-
56
-
57
-
58
-
59
-
60
-
61
-
62
-
63
-
64
-
65
-
66
-
67
-
68
-
69
-
70
-
71
-
72
-
73
-
74
-
75
-
76
-
77
-
78
-
79
-
80
-
81
-
82
-
83
-
84
-
85
-
86
-
87
-
88
-
89
-
90
-
 91
91 -
 92
92 -
 93
93 -
 94
94 -
 95
95 -
 96
96 -
 97
97 -
 98
98 -
 99
99 -
 100
100 -
 101
101 -
 102
102 -
 103
103 -
 104
104 -
 105
105 -
 106
106 -
 107
107 -
 108
108 -
 109
109 -
 110
110 -
 111
111 -
112
-
113
-
114
-
115
-
116
-
117
-
118
-
119
-
120
-
121
-
122
-
123
-
124
-
125
-
126
-
127
-
128
-
129
-
130
-
131
-
132
-
133
-
134
-
135
-
136
-
137
-
138
-
139
-
140
-
141
-
142
 |
 |

DineEquity, Inc. and Subsidiaries
Notes to the Consolidated Financial Statements (Continued)
10. Leases (Continued)
83
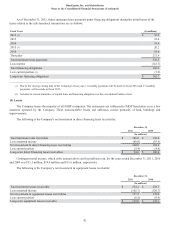
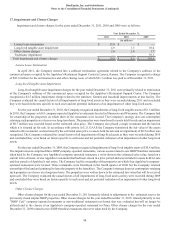
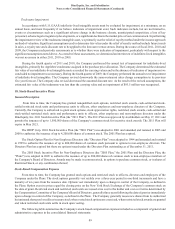
The following are minimum future lease payments on noncancelable leases as lessee at December 31, 2011:
2012
2013
2014
2015
2016
Thereafter
Total minimum lease payments
Less interest
Capital lease obligations
Less current portion (1)
Long-term capital lease obligations
Capital
Leases
(In millions)
$ 24.7
24.8
25.0
24.7
23.9
117.2
240.3
(96.3)
144.0
(9.6)
$ 134.4
Operating
Leases
$ 76.9
77.7
77.4
78.0
76.4
656.4
$ 1,042.8
(1) Included in current maturities of capital lease and financing obligations on the consolidated balance sheet.
The asset cost and carrying amount on company-owned property leased at December 31, 2011 was $89.8 million and $69.5
million, respectively. The asset cost and carrying amount on company-owned property leased at December 31, 2010, was $94.0
million and $75.1 million, respectively. The asset cost and carrying amounts represent the land and building asset values and net
book values on sites leased to franchisees.
The minimum future lease payments shown above have not been reduced by the following future minimum rents to be
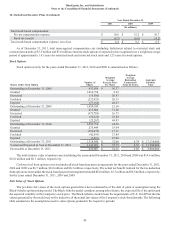
received on noncancelable subleases and leases of owned property at December 31, 2011:
2012
2013
2014
2015
2016
Thereafter
Total minimum rents receivable
Direct
Financing
Leases
(In millions)
$ 18.1
18.2
18.2
18.0
17.8
89.7
$ 180.0
Operating
Leases
$ 95.3
95.7
95.8
96.2
95.7
833.5
$ 1,312.2
The Company has noncancelable leases, expiring at various dates through 2040, which require payment of contingent rents
based upon a percentage of sales of the related restaurant as well as property taxes, insurance and other charges. Subleases to
franchisees of properties under such leases are generally for the full term of the lease obligation at rents that include the Company's
obligations for property taxes, insurance, contingent rents and other charges. Generally, the noncancelable leases include renewal
options. Contingent rent expense for all noncancelable leases for the years ended December 31, 2011, 2010 and 2009 was $2.8
million, $3.4 million and $3.9 million, respectively. Minimum rent expense for all noncancelable operating leases for the years
ended December 31, 2011, 2010 and 2009 was $81.8 million, $87.2 million and $86.6 million, respectively.
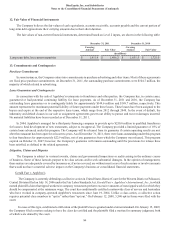
11. Fair Value Measurements
U.S GAAP pertaining to fair value measurements defines fair value as the price that would be received to sell an asset or
paid to transfer a liability in an orderly transaction between market participants at the measurement date (an exit price). U.S. GAAP
establishes a three-tier fair value hierarchy that prioritizes the inputs used in measuring fair value. These tiers include: Level 1,
defined as observable inputs such as quoted prices in active markets; Level 2, defined as inputs other than quoted prices in active
markets that are either directly or indirectly observable; and Level 3, defined as unobservable inputs in which little or no market
data exists; therefore requiring an entity to develop its own assumptions.
The Company does not have a material amount of financial instruments that are required under U.S. GAAP to be measured
on a recurring basis at fair value. None of the Company's non-financial assets or non-financial liabilities is required to be measured
at fair value on a recurring basis. The Company has not elected to use fair value measurement, as provided under U.S. GAAP, for
any assets or liabilities for which fair value measurement is not presently required.