IHOP 2011 Annual Report Download - page 66
Download and view the complete annual report
Please find page 66 of the 2011 IHOP annual report below. You can navigate through the pages in the report by either clicking on the pages listed below, or by using the keyword search tool below to find specific information within the annual report.-
 1
1 -
2
-
3
-
4
-
5
-
6
-
7
-
8
-
9
-
10
-
11
-
12
-
13
-
14
-
15
-
16
-
17
-
18
-
19
-
20
-
21
-
22
-
23
-
24
-
25
-
26
-
27
-
28
-
29
-
30
-
31
-
32
-
33
-
34
-
35
-
36
-
37
-
38
-
39
-
40
-
41
-
42
-
43
-
44
-
45
-
46
-
47
-
48
-
49
-
50
-
51
-
52
-
53
-
54
-
55
-
 56
56 -
 57
57 -
 58
58 -
 59
59 -
 60
60 -
 61
61 -
 62
62 -
 63
63 -
 64
64 -
 65
65 -
 66
66 -
 67
67 -
 68
68 -
 69
69 -
 70
70 -
 71
71 -
 72
72 -
 73
73 -
 74
74 -
 75
75 -
 76
76 -
77
-
78
-
79
-
80
-
81
-
82
-
83
-
84
-
85
-
86
-
87
-
88
-
89
-
90
-
91
-
92
-
93
-
94
-
95
-
96
-
97
-
98
-
99
-
100
-
101
-
102
-
103
-
104
-
105
-
106
-
107
-
108
-
109
-
110
-
111
-
112
-
113
-
114
-
115
-
116
-
117
-
118
-
119
-
120
-
121
-
122
-
123
-
124
-
125
-
126
-
127
-
128
-
129
-
130
-
131
-
132
-
133
-
134
-
135
-
136
-
137
-
138
-
139
-
140
-
141
-
142
 |
 |

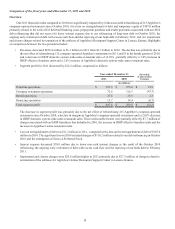
48
Other Expense and Income Components
General and administrative expenses
Interest expense
Impairment and closure charges
Amortization of intangible assets
Loss (gain) on extinguishment of debt and temporary
equity
Gain on disposition of assets
Other expense (income)
Income tax (benefit) provision
2010
(In millions)
$ 159.7
171.5
3.5
12.3
107.0
(13.6)
3.6
(9.3)
2009
$ 158.5
186.5
105.1
12.3
(45.7)
(6.9)
1.3
5.2
Favorable
(Unfavorable)
Variance
$(1.2)
15.0
101.6
—
(152.7)
6.7
(2.3)
14.5
%
Change(1)
(0.6)%
8.0 %
96.7 %
—
(334.1)%
95.4 %
(183.1)%
279.6 %
__________________________________________
(1) Percentages calculated on actual, not rounded, amounts
General and Administrative Expenses
General and administrative expenses increased $1.2 million, primarily due to an increase in stock-based compensation
expenses, higher salaries and benefits, higher travel costs and higher recruiting and relocation costs. Stock-based compensation
costs increased primarily due to the acceleration of expenses due to changes resulting from vesting of certain equity grants to
directors and the retirement of an executive and the impact of a higher stock price on equity grants accounted for as liabilities.
The increase in salaries and benefits is primarily due to an increase in managers and related training costs and the filling of open
positions at Applebee's. The increase in recruiting costs was primarily due to the hiring of more executive level positions in 2010.
Partially offsetting these increases were the absence of one-time costs of $6.3 million incurred in February 2009 related to
the establishment of a purchasing co-operative and lower professional services expenses.
Interest Expense
The $15.0 million decrease in interest expense is primarily due to the retirement of long-term debt prior to the October 2010
Refinancing and lower non-cash amortization of deferred financing costs subsequent to the October 2010 Refinancing. During
2010 and 2009, we retired $280 million of Series 2007-1 Class A-2-II-X and Series 2007-1 Class A-2-II-A Senior Notes carrying
fixed interest rates of approximately 7.1%. Based on the average balances of debt outstanding over the respective years, interest
expense was approximately $9 million lower in 2010 because of the retirements.
Non-cash amortization of deferred financing costs, debt discount and effective portion of loss on an interest swap was
approximately $40 million per year prior to the October 2010 Refinancing, while non-cash amortization of deferred financing
costs and debt discount is approximately $6 million per year after the October 2010 Refinancing.
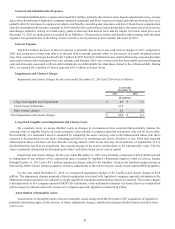
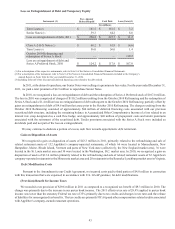
Impairment and Closure Charges
Impairment and closure charges for the years ended December 31, 2010 and 2009 were as follows:
Tradename impairment
Long-lived tangible asset impairment
Closure charges
Total impairment and closure charges
Year Ended
December 31,
2010
(In millions)
$ —
1.5
2.0
$ 3.5
2009
$ 93.5
10.4
1.2
$ 105.1