IHOP 2011 Annual Report Download - page 57
Download and view the complete annual report
Please find page 57 of the 2011 IHOP annual report below. You can navigate through the pages in the report by either clicking on the pages listed below, or by using the keyword search tool below to find specific information within the annual report.-
 1
1 -
2
-
3
-
4
-
5
-
6
-
7
-
8
-
9
-
10
-
11
-
12
-
13
-
14
-
15
-
16
-
17
-
18
-
19
-
20
-
21
-
22
-
23
-
24
-
25
-
26
-
27
-
28
-
29
-
30
-
31
-
32
-
33
-
34
-
35
-
36
-
37
-
38
-
39
-
40
-
41
-
42
-
43
-
44
-
45
-
46
-
 47
47 -
 48
48 -
 49
49 -
 50
50 -
 51
51 -
 52
52 -
 53
53 -
 54
54 -
 55
55 -
 56
56 -
 57
57 -
 58
58 -
 59
59 -
 60
60 -
 61
61 -
 62
62 -
 63
63 -
 64
64 -
 65
65 -
 66
66 -
 67
67 -
68
-
69
-
70
-
71
-
72
-
73
-
74
-
75
-
76
-
77
-
78
-
79
-
80
-
81
-
82
-
83
-
84
-
85
-
86
-
87
-
88
-
89
-
90
-
91
-
92
-
93
-
94
-
95
-
96
-
97
-
98
-
99
-
100
-
101
-
102
-
103
-
104
-
105
-
106
-
107
-
108
-
109
-
110
-
111
-
112
-
113
-
114
-
115
-
116
-
117
-
118
-
119
-
120
-
121
-
122
-
123
-
124
-
125
-
126
-
127
-
128
-
129
-
130
-
131
-
132
-
133
-
134
-
135
-
136
-
137
-
138
-
139
-
140
-
141
-
142
 |
 |

39
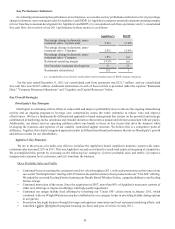
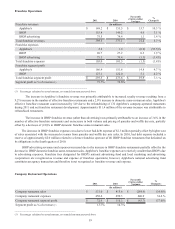
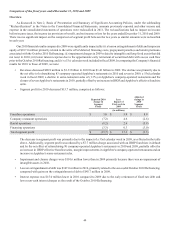
Franchise Operations
Franchise revenues
Applebee's
IHOP
IHOP advertising
Total franchise revenues
Franchise expenses
Applebee's
IHOP
IHOP advertising
Total franchise expenses
Franchise segment profit
Applebee's
IHOP
Total franchise segment profit
Segment profit as % of revenue (1)
2011
(In millions)
$ 169.2
153.8
75.5
398.5
2.8
26.7
75.5
105.0
166.4
127.1
$ 293.5
73.7%
2010
$ 153.5
149.2
74.4
377.1
1.9
27.2
74.4
103.5
151.6
122.0
$ 273.6
72.6%
Favorable
(Unfavorable)
Variance
$ 15.7
4.6
1.1
21.4
(0.9)
0.5
(1.1)
(1.5)
14.8
5.1
$ 19.9
%
Change(1)
10.3 %
3.1 %
1.4 %
5.7 %
(53.5)%
1.9 %
(1.4)%
(1.4)%
9.7 %
4.2 %
7.3 %
_________________________________________________
(1) Percentages calculated on actual amounts, not rounded amounts presented above
The increase in Applebee’s franchise revenue was primarily attributable to increased royalty revenue resulting from a
9.2% increase in the number of effective franchise restaurants and a 2.0% increase in domestic same-restaurant sales. Applebee's
effective franchise restaurant count increased by 149 due to the refranchising of 132 Applebee’s company-operated restaurants
during 2011 and net franchise restaurant development. Approximately $11.4 million of the revenue increase was attributable to
refranchised restaurants.
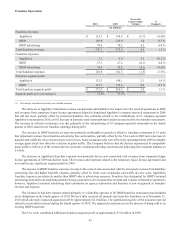
The increase in IHOP franchise revenue (other than advertising) was primarily attributable to an increase of 3.6% in the
number of effective franchise restaurants and an increase in both volume and pricing of pancake and waffle dry mix, partially
offset by a decrease of (2.0)% in IHOP domestic franchise same-restaurant sales.
The decrease in IHOP franchise expenses was due to lower bad debt expense of $2.3 million partially offset by higher cost
of sales associated with the increased revenues from pancake and waffle dry mix sales. In 2010, bad debt expense included a
reserve of approximately $2.0 million related to a former franchise operator of 40 IHOP franchise restaurants that defaulted on
its obligations in the fourth quarter of 2010.
IHOP advertising revenues and expenses increased due to the increase in IHOP franchise restaurants partially offset by the
decrease in IHOP domestic franchise same-restaurant sales. Applebee's franchise expenses are relatively smaller than IHOP's due
to advertising expenses. Franchise fees designated for IHOP's national advertising fund and local marketing and advertising
cooperatives are recognized as revenue and expense of franchise operations; however, Applebee's national advertising fund
constitutes an agency transaction and therefore is not recognized as franchise revenue and expense.
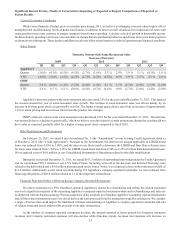
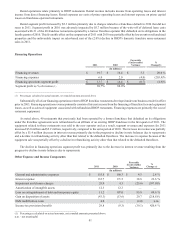
Company Restaurant Operations
Company restaurant sales
Company restaurant expenses
Company restaurant segment profit
Segment profit as % of revenue (1)
2011
(In millions)
$ 531.0
458.4
$ 72.6
13.7%
2010
$ 815.6
699.3
$ 116.3
14.3%
Favorable
(Unfavorable)
Variance
$(284.6)
240.9
$(43.7)
%
Change(1)
(34.9)%
34.4 %
(37.6)%
_________________________________________
(1) Percentages calculated on actual amounts, not rounded amounts presented above