IHOP 2011 Annual Report Download - page 80
Download and view the complete annual report
Please find page 80 of the 2011 IHOP annual report below. You can navigate through the pages in the report by either clicking on the pages listed below, or by using the keyword search tool below to find specific information within the annual report.-
 1
1 -
2
-
3
-
4
-
5
-
6
-
7
-
8
-
9
-
10
-
11
-
12
-
13
-
14
-
15
-
16
-
17
-
18
-
19
-
20
-
21
-
22
-
23
-
24
-
25
-
26
-
27
-
28
-
29
-
30
-
31
-
32
-
33
-
34
-
35
-
36
-
37
-
38
-
39
-
40
-
41
-
42
-
43
-
44
-
45
-
46
-
47
-
48
-
49
-
50
-
51
-
52
-
53
-
54
-
55
-
56
-
57
-
58
-
59
-
60
-
61
-
62
-
63
-
64
-
65
-
66
-
67
-
68
-
69
-
 70
70 -
 71
71 -
 72
72 -
 73
73 -
 74
74 -
 75
75 -
 76
76 -
 77
77 -
 78
78 -
 79
79 -
 80
80 -
 81
81 -
 82
82 -
 83
83 -
 84
84 -
 85
85 -
 86
86 -
 87
87 -
 88
88 -
 89
89 -
 90
90 -
91
-
92
-
93
-
94
-
95
-
96
-
97
-
98
-
99
-
100
-
101
-
102
-
103
-
104
-
105
-
106
-
107
-
108
-
109
-
110
-
111
-
112
-
113
-
114
-
115
-
116
-
117
-
118
-
119
-
120
-
121
-
122
-
123
-
124
-
125
-
126
-
127
-
128
-
129
-
130
-
131
-
132
-
133
-
134
-
135
-
136
-
137
-
138
-
139
-
140
-
141
-
142
 |
 |

62
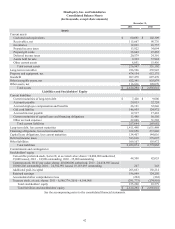
DineEquity, Inc. and Subsidiaries
Consolidated Balance Sheets
(In thousands, except share amounts)
Assets
Current assets
Cash and cash equivalents
Receivables, net
Inventories
Prepaid income taxes
Prepaid gift cards
Deferred income taxes
Assets held for sale
Other current assets
Total current assets
Long-term receivables
Property and equipment, net
Goodwill
Other intangible assets, net
Other assets, net
Total assets
Liabilities and Stockholders' Equity
Current liabilities
Current maturities of long-term debt
Accounts payable
Accrued employee compensation and benefits
Gift card liability
Accrued interest payable
Current maturities of capital lease and financing obligations
Other accrued expenses
Total current liabilities
Long-term debt, less current maturities
Financing obligations, less current maturities
Capital lease obligations, less current maturities
Deferred income taxes
Other liabilities
Total liabilities
Commitments and contingencies
Stockholders' equity
Convertible preferred stock, Series B, at accreted value; shares: 10,000,000 authorized;
35,000 issued; 2011 - 34,900 outstanding; 2010 - 35,000 outstanding
Common stock, $0.01 par value; shares: 40,000,000 authorized; 2011 - 24,658,985 issued,
18,060,206 outstanding; 2010 - 24,382,991 issued, 18,183,083 outstanding
Additional paid-in-capital
Retained earnings
Accumulated other comprehensive loss
Treasury stock, at cost; shares: 2011 - 6,598,779; 2010 - 6,199,908
Total stockholders' equity
Total liabilities and stockholders' equity
December 31,
2011
$ 60,691
115,667
12,031
13,922
36,643
20,579
9,363
8,051
276,947
226,526
474,154
697,470
822,361
116,836
$ 2,614,294
$ 7,420
29,013
26,191
146,955
12,537
13,480
22,048
257,644
1,411,448
162,658
134,407
383,810
109,107
2,459,074
44,508
247
205,663
196,869
(294)
(291,773)
155,220
$ 2,614,294
2010
$ 102,309
98,776
10,757
34,094
27,465
24,301
37,944
15,456
351,102
239,945
612,175
697,470
835,879
120,070
$ 2,856,641
$ 9,000
32,724
32,846
124,972
17,482
16,556
31,502
265,082
1,631,469
237,826
144,016
375,697
118,972
2,773,062
42,055
243
192,214
124,250
(282)
(274,901)
83,579
$ 2,856,641
See the accompanying notes to the consolidated financial statements.