IHOP 2011 Annual Report Download - page 81
Download and view the complete annual report
Please find page 81 of the 2011 IHOP annual report below. You can navigate through the pages in the report by either clicking on the pages listed below, or by using the keyword search tool below to find specific information within the annual report.-
 1
1 -
2
-
3
-
4
-
5
-
6
-
7
-
8
-
9
-
10
-
11
-
12
-
13
-
14
-
15
-
16
-
17
-
18
-
19
-
20
-
21
-
22
-
23
-
24
-
25
-
26
-
27
-
28
-
29
-
30
-
31
-
32
-
33
-
34
-
35
-
36
-
37
-
38
-
39
-
40
-
41
-
42
-
43
-
44
-
45
-
46
-
47
-
48
-
49
-
50
-
51
-
52
-
53
-
54
-
55
-
56
-
57
-
58
-
59
-
60
-
61
-
62
-
63
-
64
-
65
-
66
-
67
-
68
-
69
-
70
-
 71
71 -
 72
72 -
 73
73 -
 74
74 -
 75
75 -
 76
76 -
 77
77 -
 78
78 -
 79
79 -
 80
80 -
 81
81 -
 82
82 -
 83
83 -
 84
84 -
 85
85 -
 86
86 -
 87
87 -
 88
88 -
 89
89 -
 90
90 -
 91
91 -
92
-
93
-
94
-
95
-
96
-
97
-
98
-
99
-
100
-
101
-
102
-
103
-
104
-
105
-
106
-
107
-
108
-
109
-
110
-
111
-
112
-
113
-
114
-
115
-
116
-
117
-
118
-
119
-
120
-
121
-
122
-
123
-
124
-
125
-
126
-
127
-
128
-
129
-
130
-
131
-
132
-
133
-
134
-
135
-
136
-
137
-
138
-
139
-
140
-
141
-
142
 |
 |

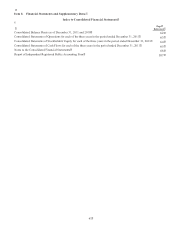
63
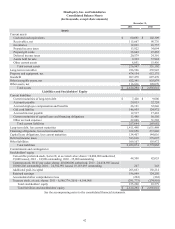
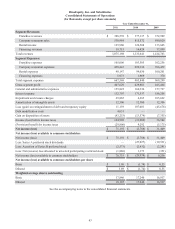
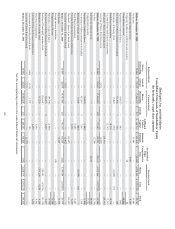
DineEquity, Inc. and Subsidiaries
Consolidated Statements of Operations
(In thousands, except per share amounts)
Segment Revenues:
Franchise revenues
Company restaurant sales
Rental income
Financing revenues
Total revenues
Segment Expenses:
Franchise expenses
Company restaurant expenses
Rental expenses
Financing expenses
Total segment expenses
Gross segment profit
General and administrative expenses
Interest expense
Impairment and closure charges
Amortization of intangible assets
Loss (gain) on extinguishment of debt and temporary equity
Debt modification costs
Gain on disposition of assets
Income (loss) before income taxes
(Provision) benefit for income taxes
Net income (loss)
Net income (loss) available to common stockholders
Net income (loss)
Less: Series A preferred stock dividends
Less: Accretion of Series B preferred stock
Less: Net (income) loss allocated to unvested participating restricted stock
Net income (loss) available to common stockholders
Net income (loss) available to common stockholders per share
Basic
Diluted
Weighted average shares outstanding
Basic
Diluted
Year Ended December 31,
2011
$ 398,539
530,984
125,960
19,715
1,075,198
105,006
458,443
98,147
5,973
667,569
407,629
155,822
132,707
29,865
12,300
11,159
4,031
(43,253)
104,998
(29,806)
$ 75,192
$ 75,192
—
(2,573)
(1,886)
$ 70,733
$ 3.96
$ 3.89
17,846
18,185
2010
$ 377,137
815,572
124,508
16,424
1,333,641
103,505
699,336
99,030
1,969
903,840
429,801
160,330
171,537
4,285
12,300
107,003
—
(13,574)
(12,080)
9,292
$(2,788)
$(2,788)
(25,927)
(2,432)
1,173
$(29,974)
$(1.74)
$(1.74)
17,240
17,240
2009
$ 372,999
890,020
133,845
17,899
1,414,763
102,256
766,472
100,201
370
969,299
445,464
157,727
186,258
105,622
12,306
(45,678)
—
(7,355)
36,584
(5,175)
$ 31,409
$ 31,409
(19,531)
(2,291)
(351)
$ 9,236
$ 0.55
$ 0.55
16,917
16,917
See the accompanying notes to the consolidated financial statements.