IHOP 2011 Annual Report Download - page 72
Download and view the complete annual report
Please find page 72 of the 2011 IHOP annual report below. You can navigate through the pages in the report by either clicking on the pages listed below, or by using the keyword search tool below to find specific information within the annual report.-
 1
1 -
2
-
3
-
4
-
5
-
6
-
7
-
8
-
9
-
10
-
11
-
12
-
13
-
14
-
15
-
16
-
17
-
18
-
19
-
20
-
21
-
22
-
23
-
24
-
25
-
26
-
27
-
28
-
29
-
30
-
31
-
32
-
33
-
34
-
35
-
36
-
37
-
38
-
39
-
40
-
41
-
42
-
43
-
44
-
45
-
46
-
47
-
48
-
49
-
50
-
51
-
52
-
53
-
54
-
55
-
56
-
57
-
58
-
59
-
60
-
61
-
 62
62 -
 63
63 -
 64
64 -
 65
65 -
 66
66 -
 67
67 -
 68
68 -
 69
69 -
 70
70 -
 71
71 -
 72
72 -
 73
73 -
 74
74 -
 75
75 -
 76
76 -
 77
77 -
 78
78 -
 79
79 -
 80
80 -
 81
81 -
 82
82 -
83
-
84
-
85
-
86
-
87
-
88
-
89
-
90
-
91
-
92
-
93
-
94
-
95
-
96
-
97
-
98
-
99
-
100
-
101
-
102
-
103
-
104
-
105
-
106
-
107
-
108
-
109
-
110
-
111
-
112
-
113
-
114
-
115
-
116
-
117
-
118
-
119
-
120
-
121
-
122
-
123
-
124
-
125
-
126
-
127
-
128
-
129
-
130
-
131
-
132
-
133
-
134
-
135
-
136
-
137
-
138
-
139
-
140
-
141
-
142
 |
 |

54
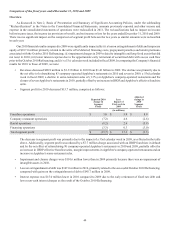
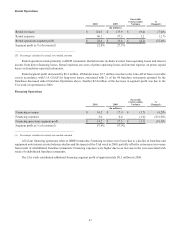
income from direct financing leases. Rental income is impacted by fluctuations in same-restaurant sales as some operating leases
include a provision for contingent rent based on retail sales. Rental expenses are costs of prime operating leases and interest
expense on prime capital leases on franchisee-operated restaurants. Financing operations revenue consists of interest income from
the financing of franchise fees and equipment leases as well as periodic sales of equipment . Financing expenses are primarily the
cost of restaurant equipment.
Cash provided by operating activities totaled $121.7 million during the year ended December 31, 2011 compared to $179.3
million in the same period in 2010, a decrease of $57.6 million. The primary reasons for this unfavorable change were lower
segment profit, excluding depreciation changes, of $32.8 million, a cash payment of $21.3 million related to the termination of
the sublease of Applebee's Restaurant Support Center and an increase of $7.8 million in cash interest payments. The lower segment
profit was due, in large part, to the refranchising of 215 Applebee's company-operated restaurants since October 2010.
Investing Activities
Net cash provided by investing activities in 2011 was primarily attributable to $115.6 million of proceeds from dispositions
of assets, primarily the refranchising of 132 Applebee's company-operated restaurants, and $13.1 million of principal receipts
from notes, equipment contracts and other long-term receivables, partially offset by $26.3 million of capital expenditures. Capital
expenditures increased from $18.7 million in 2010 due primarily to the remodeling of company-operated restaurants and increases
in information technology infrastructure expenditures. Capital expenditures are expected to range between approximately
$18 million and $20 million in fiscal 2012. The change from 2011 is primarily due to a decline in expenditures for remodeling
company-operated restaurants.
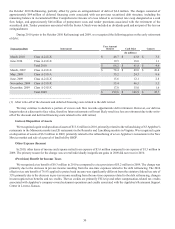
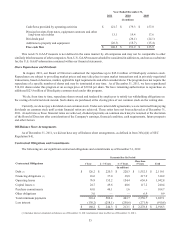
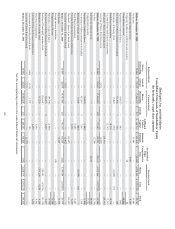
The following table represents the principal receipts on various long-term receivables due from our franchisees as of
December 31, 2011:
Equipment leases(1)
Direct financing leases(2)
Franchise notes and other(3)
Total
Principal Receipts Due By Period
2012
(In millions)
$ 6.5
5.4
1.9
$ 13.8
2013
$ 6.9
6.3
1.2
$ 14.4
2014
$ 7.2
7.1
0.8
$ 15.1
2015
$ 7.2
8.0
0.6
$ 15.8
2016
$ 8.2
8.9
0.3
$ 17.4
Thereafter
$ 95.4
64.3
0.2
$ 159.9
Total
$ 131.4
100.0
5.0
$ 236.4
_______________________________
(1) Equipment lease receivables extend through the year 2029.
(2) Direct financing lease receivables extend through the year 2024.
(3) Franchise note receivables extend through the year 2019.
Financing Activities
Financing activities used net cash of $265.0 million during 2011. Cash used in financing activities primarily consisted of
$239.1 million in repayments of long-term debt, purchases of DineEquity common stock of $21.2 million, and payment of debt
issuance costs of $12.3 million, partially offset by a net cash inflow of $7.1 million from equity-based compensation transactions.
Of the long-term debt repayments, $161.5 million related to Term Loans, $64.2 million related to Senior Notes (including $4.9
million of premiums) and $13.4 million was scheduled repayments of capital leases and financing obligations. During 2011, we
borrowed and repaid $40.0 million under our Revolving Facility.
Free Cash Flow
We define "free cash flow" for a given period as cash provided by operating activities, plus receipts from notes and equipment
contracts receivable ("long-term notes receivable"), less dividends paid and capital expenditures. We believe this information is
helpful to investors to determine our cash available for general corporate and strategic purposes, including the retirement of debt.
Free cash flow is considered to be a non-U.S. GAAP measure. Reconciliation of the cash provided by operating activities
to free cash flow is as follows: