IHOP 2011 Annual Report Download - page 117
Download and view the complete annual report
Please find page 117 of the 2011 IHOP annual report below. You can navigate through the pages in the report by either clicking on the pages listed below, or by using the keyword search tool below to find specific information within the annual report.-
 1
1 -
2
-
3
-
4
-
5
-
6
-
7
-
8
-
9
-
10
-
11
-
12
-
13
-
14
-
15
-
16
-
17
-
18
-
19
-
20
-
21
-
22
-
23
-
24
-
25
-
26
-
27
-
28
-
29
-
30
-
31
-
32
-
33
-
34
-
35
-
36
-
37
-
38
-
39
-
40
-
41
-
42
-
43
-
44
-
45
-
46
-
47
-
48
-
49
-
50
-
51
-
52
-
53
-
54
-
55
-
56
-
57
-
58
-
59
-
60
-
61
-
62
-
63
-
64
-
65
-
66
-
67
-
68
-
69
-
70
-
71
-
72
-
73
-
74
-
75
-
76
-
77
-
78
-
79
-
80
-
81
-
82
-
83
-
84
-
85
-
86
-
87
-
88
-
89
-
90
-
91
-
92
-
93
-
94
-
95
-
96
-
97
-
98
-
99
-
100
-
101
-
102
-
103
-
104
-
105
-
106
-
 107
107 -
 108
108 -
 109
109 -
 110
110 -
 111
111 -
 112
112 -
 113
113 -
 114
114 -
 115
115 -
 116
116 -
 117
117 -
 118
118 -
 119
119 -
 120
120 -
 121
121 -
 122
122 -
 123
123 -
 124
124 -
 125
125 -
 126
126 -
 127
127 -
128
-
129
-
130
-
131
-
132
-
133
-
134
-
135
-
136
-
137
-
138
-
139
-
140
-
141
-
142
 |
 |

DineEquity, Inc. and Subsidiaries
Notes to the Consolidated Financial Statements (Continued)
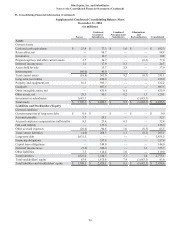
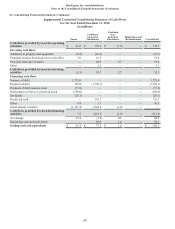
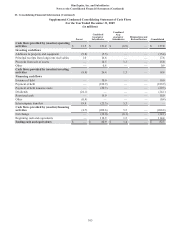
23. Consolidating Financial Information (Continued)
99
Supplemental Condensed Consolidating Balance Sheet
December 31, 2010
(in millions)
Assets
Current Assets
Cash and cash equivalents
Receivables, net
Inventories
Prepaid expenses and other current assets
Deferred income taxes
Assets held for sale
Intercompany
Total current assets
Long-term receivables
Property and equipment, net
Goodwill
Other intangible assets, net
Other assets, net
Investment in subsidiaries
Total assets
Liabilities and Stockholders' Equity
Current Liabilities
Current maturities of long-term debt
Accounts payable
Accrued employee compensation and benefits
Gift card liability
Other accrued expenses
Total current liabilities
Long-term debt
Financing obligations
Capital lease obligations
Deferred income taxes
Other liabilities
Total liabilities
Total stockholders' equity
Total liabilities and stockholders' equity
Parent
$ 23.4
—
—
2.7
1.1
—
(46.0)
(18.8)
—
16.5
—
—
28.3
1,683.3
$ 1,709.3
$ 9.0
3.7
9.3
—
(26.0)
(4.0)
1,631.5
—
—
(5.6)
3.5
1,625.4
83.9
$ 1,709.3
Combined
Guarantor
Subsidiaries
$ 77.3
98.7
10.7
74.7
17.9
35.7
46.0
361.0
240.0
595.7
697.5
835.8
90.1
—
$ 2,820.1
$ —
29.1
23.4
125.0
90.8
268.3
—
237.8
144.0
380.0
114.4
1,144.5
1,675.6
$ 2,820.1
Combined
Non-guarantor
Subsidiaries
$ 1.6
—
—
—
5.3
2.3
—
9.2
—
—
—
0.1
0.2
—
$ 9.5
$ —
—
0.1
—
1.0
1.1
—
—
—
—
1.0
2.1
7.4
$ 9.5
Eliminations
and
Reclassification
$ —
—
—
(0.3)
—
—
—
(0.3)
—
—
—
—
1.3
(1,683.3)
$(1,682.3)
$ —
—
—
—
(0.3)
(0.3)
—
—
—
1.3
—
1.0
(1,683.3)
$(1,682.3)
Consolidated
$ 102.3
98.8
10.8
77.0
24.3
37.9
—
351.1
239.9
612.2
697.5
835.9
120.1
—
$ 2,856.6
$ 9.0
32.7
32.8
125.0
65.5
265.1
1,631.5
237.8
144.0
375.7
119.0
2,773.1
83.6
$ 2,856.6