IHOP 2011 Annual Report Download - page 114
Download and view the complete annual report
Please find page 114 of the 2011 IHOP annual report below. You can navigate through the pages in the report by either clicking on the pages listed below, or by using the keyword search tool below to find specific information within the annual report.-
 1
1 -
2
-
3
-
4
-
5
-
6
-
7
-
8
-
9
-
10
-
11
-
12
-
13
-
14
-
15
-
16
-
17
-
18
-
19
-
20
-
21
-
22
-
23
-
24
-
25
-
26
-
27
-
28
-
29
-
30
-
31
-
32
-
33
-
34
-
35
-
36
-
37
-
38
-
39
-
40
-
41
-
42
-
43
-
44
-
45
-
46
-
47
-
48
-
49
-
50
-
51
-
52
-
53
-
54
-
55
-
56
-
57
-
58
-
59
-
60
-
61
-
62
-
63
-
64
-
65
-
66
-
67
-
68
-
69
-
70
-
71
-
72
-
73
-
74
-
75
-
76
-
77
-
78
-
79
-
80
-
81
-
82
-
83
-
84
-
85
-
86
-
87
-
88
-
89
-
90
-
91
-
92
-
93
-
94
-
95
-
96
-
97
-
98
-
99
-
100
-
101
-
102
-
103
-
 104
104 -
 105
105 -
 106
106 -
 107
107 -
 108
108 -
 109
109 -
 110
110 -
 111
111 -
 112
112 -
 113
113 -
 114
114 -
 115
115 -
 116
116 -
 117
117 -
 118
118 -
 119
119 -
 120
120 -
 121
121 -
 122
122 -
 123
123 -
 124
124 -
125
-
126
-
127
-
128
-
129
-
130
-
131
-
132
-
133
-
134
-
135
-
136
-
137
-
138
-
139
-
140
-
141
-
142
 |
 |

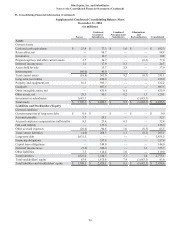
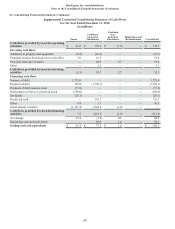
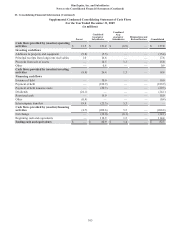
DineEquity, Inc. and Subsidiaries
Notes to the Consolidated Financial Statements (Continued)
96
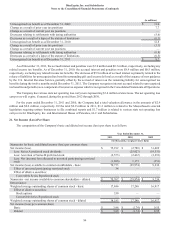
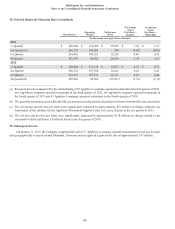
22. Segment Reporting
Information on segments and a reconciliation to income (loss) before income taxes are as follows:
Revenues
Franchise operations
Company restaurants
Rental operations
Financing operations
Total
Income (loss) before income taxes
Franchise operations
Company restaurants
Rental operations
Financing operations
Corporate
Income (loss) before income taxes
Interest Expense
Company restaurants
Rental operations
Corporate
Total
Depreciation and amortization
Franchise operations
Company restaurants
Rental operations
Corporate
Total
Impairment and closure charges
Franchise operations
Company restaurants
Corporate
Total
Capital Expenditures
Franchise operations
Company restaurants
Corporate
Total
Goodwill (all franchise segment)
Total Assets
Franchise operations
Company restaurants
Rental operations
Financing operations
Corporate
Total
Year Ended December 31,
2011
(In millions)
$ 398.5
531.0
126.0
19.7
$ 1,075.2
$ 293.5
72.6
27.8
13.7
(302.6)
$ 105.0
$ 0.5
18.0
132.7
$ 151.2
$ 9.9
16.6
14.0
9.7
$ 50.2
$ —
2.4
27.5
$ 29.9
$ —
15.5
10.8
$ 26.3
$ 697.5
$ 1,472.3
423.1
407.9
136.4
174.6
$ 2,614.3
2010
$ 377.1
815.6
124.5
16.4
$ 1,333.6
$ 273.6
116.2
25.5
14.5
(441.9)
$ (12.1)
$ 0.8
18.9
171.5
$ 191.2
$ 10.0
27.1
13.9
10.4
$ 61.4
$ —
4.3
—
$ 4.3
$ —
9.5
9.2
$ 18.7
$ 697.5
$ 1,472.2
513.7
425.8
146.8
298.1
$ 2,856.6
2009
$ 373.0
890.0
133.9
17.9
$ 1,414.8
$ 270.0
123.5
36.6
17.5
(411.0)
$ 36.6
$ 0.9
20.1
186.3
$ 207.3
$ 10.0
30.1
14.5
10.8
$ 65.4
$ 74.7
30.9
—
$ 105.6
$ 0.4
5.8
9.2
$ 15.4
$ 697.5
$ 1,478.7
647.5
433.0
182.1
359.6
$ 3,100.9