IHOP 2011 Annual Report Download - page 71
Download and view the complete annual report
Please find page 71 of the 2011 IHOP annual report below. You can navigate through the pages in the report by either clicking on the pages listed below, or by using the keyword search tool below to find specific information within the annual report.-
 1
1 -
2
-
3
-
4
-
5
-
6
-
7
-
8
-
9
-
10
-
11
-
12
-
13
-
14
-
15
-
16
-
17
-
18
-
19
-
20
-
21
-
22
-
23
-
24
-
25
-
26
-
27
-
28
-
29
-
30
-
31
-
32
-
33
-
34
-
35
-
36
-
37
-
38
-
39
-
40
-
41
-
42
-
43
-
44
-
45
-
46
-
47
-
48
-
49
-
50
-
51
-
52
-
53
-
54
-
55
-
56
-
57
-
58
-
59
-
60
-
 61
61 -
 62
62 -
 63
63 -
 64
64 -
 65
65 -
 66
66 -
 67
67 -
 68
68 -
 69
69 -
 70
70 -
 71
71 -
 72
72 -
 73
73 -
 74
74 -
 75
75 -
 76
76 -
 77
77 -
 78
78 -
 79
79 -
 80
80 -
 81
81 -
82
-
83
-
84
-
85
-
86
-
87
-
88
-
89
-
90
-
91
-
92
-
93
-
94
-
95
-
96
-
97
-
98
-
99
-
100
-
101
-
102
-
103
-
104
-
105
-
106
-
107
-
108
-
109
-
110
-
111
-
112
-
113
-
114
-
115
-
116
-
117
-
118
-
119
-
120
-
121
-
122
-
123
-
124
-
125
-
126
-
127
-
128
-
129
-
130
-
131
-
132
-
133
-
134
-
135
-
136
-
137
-
138
-
139
-
140
-
141
-
142
 |
 |

53
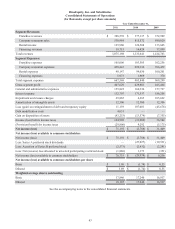
Trailing Twelve Months Ended December 31, 2011
U.S. GAAP income before income taxes
Interest charges
Loss on extinguishment of debt
Depreciation and amortization
Non-cash stock-based compensation
Impairment and closure charges
Other
Gain on disposition of assets
EBITDA
(in thousands)
$ 104,998
151,332
11,159
50,220
9,492
29,643
6,830
(43,253)
$ 320,421
We believe this non-U.S. GAAP measure is useful in evaluating our results of operations in reference to compliance with
the debt covenants discussed above. This non-U.S. GAAP measure is not defined in the same manner by all companies and may
not be comparable to other similarly titled measures of other companies. Non-U.S. GAAP measures should be considered in
addition to, and not as a substitute for, the U.S. GAAP information contained within our financial statements.
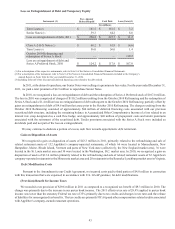
Franchising of Applebee's Company-Operated Restaurants
During 2011, we completed the refranchising and sale of related restaurant assets of 132 Applebee's company-operated
restaurants. Proceeds from asset dispositions, including the 132 restaurants, totaled $115.6 million for the twelve months ended
2011, the majority of which was used to retire debt.
Since the Applebee's acquisition we have pursued a strategy to transition from the 74% franchised Applebee's system at the
time of the acquisition to a 99% franchised Applebee's system, similar to IHOP's 99% franchised system. As of December 31,
2011, we have refranchised 325 Applebee's company-operated restaurants since the second quarter of 2008. Subsequent to
December 31, 2011 we refranchised 17 Applebee's company-operated restaurants in a six-state market area geographically centered
around Memphis, Tennessee in January, 2012. Including the 17 restaurants refranchised in January 2012, the Applebee's system
is approximately 91% franchised. We are planning to franchise a significant majority of the remaining Applebee's company-
operated restaurants over the next several years while retaining 23 restaurants in the Kansas City area as a Company market. This
highly franchised business model is expected to require less capital investment, improve margins and reduce the volatility of cash
flow performance over time, while also providing cash proceeds from the refranchising of the restaurants for the retirement of
debt. Under the terms of the Credit Agreement, all of the proceeds of future asset dispositions must be used to repay borrowings
under the Term Facility and under certain conditions, we may be required to repurchase Senior Notes with excess proceeds of
assets sales, as defined in the Indenture under which the Senior Notes were issued.
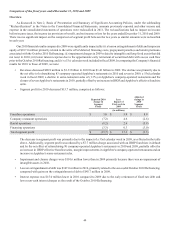
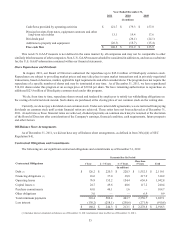
Cash Flows
In summary, our cash flows were as follows:
Net cash provided by operating activities
Net cash provided by investing activities
Net cash used in financing activities
Net (decrease) increase in cash and cash equivalents
2011
(In millions)
$ 121.7
101.7
(265.0)
$(41.6)
2010
$ 179.3
53.5
(212.8)
$ 20.0
2009
$ 157.8
18.8
(208.8)
$(32.2)
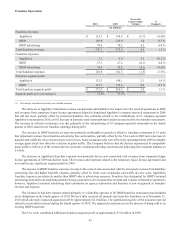
Operating Activities
Cash provided by operating activities is primarily driven by revenues earned and collected from our franchisees, operating
earnings from our company-operated restaurants and profit from our rental operations and financing operations. Franchise revenues
consist of royalties, IHOP advertising fees and sales of proprietary products for IHOP, each of which fluctuates with increases or
decreases in franchise retail sales. Franchise retail sales are impacted by the development of IHOP and Applebee's restaurants by
our franchisees and by fluctuations in same-restaurant sales. Operating earnings from company-operated restaurants are impacted
by many factors which include but are not limited to changes in traffic patterns, pricing activities and changes in operating expenses.
Rental operations profit is rental income less rental expenses. Rental income includes revenues from operating leases and interest