IHOP 2011 Annual Report Download - page 55
Download and view the complete annual report
Please find page 55 of the 2011 IHOP annual report below. You can navigate through the pages in the report by either clicking on the pages listed below, or by using the keyword search tool below to find specific information within the annual report.-
 1
1 -
2
-
3
-
4
-
5
-
6
-
7
-
8
-
9
-
10
-
11
-
12
-
13
-
14
-
15
-
16
-
17
-
18
-
19
-
20
-
21
-
22
-
23
-
24
-
25
-
26
-
27
-
28
-
29
-
30
-
31
-
32
-
33
-
34
-
35
-
36
-
37
-
38
-
39
-
40
-
41
-
42
-
43
-
44
-
 45
45 -
 46
46 -
 47
47 -
 48
48 -
 49
49 -
 50
50 -
 51
51 -
 52
52 -
 53
53 -
 54
54 -
 55
55 -
 56
56 -
 57
57 -
 58
58 -
 59
59 -
 60
60 -
 61
61 -
 62
62 -
 63
63 -
 64
64 -
 65
65 -
66
-
67
-
68
-
69
-
70
-
71
-
72
-
73
-
74
-
75
-
76
-
77
-
78
-
79
-
80
-
81
-
82
-
83
-
84
-
85
-
86
-
87
-
88
-
89
-
90
-
91
-
92
-
93
-
94
-
95
-
96
-
97
-
98
-
99
-
100
-
101
-
102
-
103
-
104
-
105
-
106
-
107
-
108
-
109
-
110
-
111
-
112
-
113
-
114
-
115
-
116
-
117
-
118
-
119
-
120
-
121
-
122
-
123
-
124
-
125
-
126
-
127
-
128
-
129
-
130
-
131
-
132
-
133
-
134
-
135
-
136
-
137
-
138
-
139
-
140
-
141
-
142
 |
 |

37
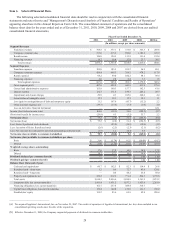
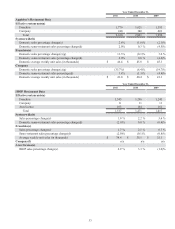
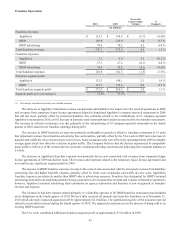
The following tables summarize Applebee's and IHOP restaurant development and franchising activity.
Applebee's Restaurant Development Activity
Total restaurants, beginning of year
New openings
Franchise
Total new openings
Closings
Company
Franchise
Total closings
Total restaurants, end of year
Summary—end of year
Franchise
Company
Total
Applebee's Franchise Restaurant Activity
Domestic franchise openings
International franchise openings
Refranchised
Total restaurants franchised
Closings
Domestic franchise
International franchise
Total franchise closings
Net franchise restaurant additions
Year Ended December 31,
2011
2,010
24
24
—
(15)
(15)
2,019
1,842
177
2,019
15
9
132
156
(6)
(9)
(15)
141
2010
2,008
27
27
(7)
(18)
(25)
2,010
1,701
309
2,010
14
13
83
110
(14)
(4)
(18)
92
2009
2,004
33
33
—
(29)
(29)
2,008
1,609
399
2,008
18
15
7
40
(25)
(4)
(29)
11
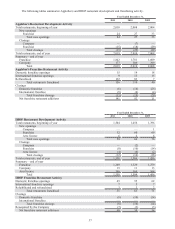
IHOP Restaurant Development Activity
Total restaurants, beginning of year
New openings
Company
Franchise
Area license
Total new openings
Closings
Company
Franchise
Area license
Total closings
Total restaurants, end of year
Summary—end of year
Franchise
Company
Area license
Total
IHOP Franchise Restaurant Activity
Domestic franchise openings
International franchise openings
Rehabilitated and refranchised
Total restaurants franchised
Closings
Domestic franchise
International franchise
Total franchise closings
Reacquired by the Company
Net franchise restaurant additions
Year Ended December 31,
2011
1,504
—
52
6
58
—
(8)
(4)
(12)
1,550
1,369
15
166
1,550
45
7
3
55
(8)
—
(8)
(7)
40
2010
1,456
—
60
4
64
(2)
(10)
(4)
(16)
1,504
1,329
11
164
1,504
55
5
3
63
(10)
—
(10)
(3)
50
2009
1,396
1
69
6
76
—
(14)
(2)
(16)
1,456
1,279
13
164
1,456
62
7
2
71
(14)
—
(14)
(3)
54