IHOP 2011 Annual Report Download - page 48
Download and view the complete annual report
Please find page 48 of the 2011 IHOP annual report below. You can navigate through the pages in the report by either clicking on the pages listed below, or by using the keyword search tool below to find specific information within the annual report.-
 1
1 -
2
-
3
-
4
-
5
-
6
-
7
-
8
-
9
-
10
-
11
-
12
-
13
-
14
-
15
-
16
-
17
-
18
-
19
-
20
-
21
-
22
-
23
-
24
-
25
-
26
-
27
-
28
-
29
-
30
-
31
-
32
-
33
-
34
-
35
-
36
-
37
-
 38
38 -
 39
39 -
 40
40 -
 41
41 -
 42
42 -
 43
43 -
 44
44 -
 45
45 -
 46
46 -
 47
47 -
 48
48 -
 49
49 -
 50
50 -
 51
51 -
 52
52 -
 53
53 -
 54
54 -
 55
55 -
 56
56 -
 57
57 -
 58
58 -
59
-
60
-
61
-
62
-
63
-
64
-
65
-
66
-
67
-
68
-
69
-
70
-
71
-
72
-
73
-
74
-
75
-
76
-
77
-
78
-
79
-
80
-
81
-
82
-
83
-
84
-
85
-
86
-
87
-
88
-
89
-
90
-
91
-
92
-
93
-
94
-
95
-
96
-
97
-
98
-
99
-
100
-
101
-
102
-
103
-
104
-
105
-
106
-
107
-
108
-
109
-
110
-
111
-
112
-
113
-
114
-
115
-
116
-
117
-
118
-
119
-
120
-
121
-
122
-
123
-
124
-
125
-
126
-
127
-
128
-
129
-
130
-
131
-
132
-
133
-
134
-
135
-
136
-
137
-
138
-
139
-
140
-
141
-
142
 |
 |

30
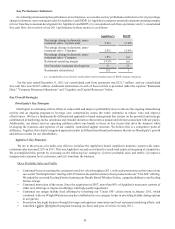
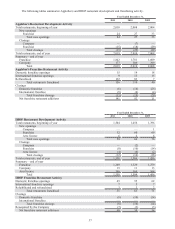
Key Performance Indicators
In evaluating and assessing the performance of our business, we consider our key performance indicators to be: (i) percentage
change in domestic same-restaurant sales for Applebee's and IHOP; (ii) Applebee's company-operated restaurant operating margin;
(iii) net franchise restaurant development for Applebee's and IHOP; (iv) consolidated cash from operations; and (v) consolidated
free cash flow. An overview of our 2011 performance in these metrics is as follows:
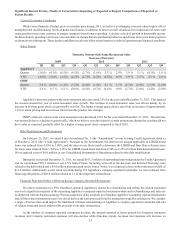
Percentage change in domestic same-
restaurant sales - System-wide
Percentage change in domestic same-
restaurant sales - Franchise
Percentage change in domestic same-
restaurant sales - Company
Restaurant operating margin
Net Franchise restaurant development
Restaurants refranchised
Applebee's
2.0%
2.0%
1.8%
14.5%
9
132
IHOP
(2.0)%
(2.0)%
n/a
n/a
37
3
n/a - not applicable given relatively small number and test-market nature of IHOP company restaurants
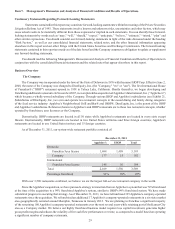
For the year ended December 31, 2011 our consolidated cash from operations was $121.7 million and our consolidated
free cash flow was $108.5 million. Additional information on each of these metrics is presented under the captions "Restaurant
Data," "Company Restaurant Operations" and "Liquidity and Capital Resources" below.
Key Overall Strategies
DineEquity's Key Strategies
DineEquity is continuing with its efforts to reduce debt and improve profitability. Keys to this are the ongoing refranchising
activity and an ongoing program to leverage core competencies across the entire enterprise to reduce costs and improve
effectiveness. We have a fundamentally differentiated approach to brand management that centers on the powerful and strategic
combination of marketing, menu, operations and remodel initiatives that creates a unique and relevant connection with our guests.
Additionally, our shared services operating platform allows our brands to focus on key factors that drive the business while
leveraging the resources and expertise of our scalable, centralized support structure. We believe this is a competitive point of
difference. Together, this closely integrated approach results in differentiated brand performance that drives DineEquity's growth
and delivers results for our shareholders.
Applebee's Key Strategies
We are in the process of a multi-year effort to revitalize the Applebee's brand. Applebee's domestic system-wide same-
restaurant sales increased 2.0% in 2011. This was Applebee's second year of positive results and outpaced our group of competitors.
We accomplished this growth by executing on the following key strategies: (i) drive profitable sales and traffic; (ii) improve
margins and restaurant level economics; and (iii) transform the business.
Drive Profitable Sales and Traffic
• Continued focus on meeting the consumer's need for value throughout 2011, with such promotions as the return of our
successful "Sizzling Entrées" starting at $8.99 nationwide and the rotation of new products into our “2 for $20” offering.
We ended the year with Sizzling Entrées featuring our Double Barrel Whiskey Sirloin, a popular addition to our Sizzling
Entrées lineup;
• Continued innovation of the menu. Since the acquisition in 2007, more than 80% of Applebee's menu now consists of
either new offerings or improved offerings with high quality ingredients;
• Continued our unique healthy food offerings by refreshing our "Under 550" calorie menu in January 2011, which
combined with our Weight Watchers menu has established us as a category leader in providing healthy dining options
to our guests;
• Focused on late night business through beverage and appetizer innovation and local restaurant marketing efforts; and
• Launched a lunch program focusing on choice and pace of service in early 2011.