IHOP 2011 Annual Report Download - page 51
Download and view the complete annual report
Please find page 51 of the 2011 IHOP annual report below. You can navigate through the pages in the report by either clicking on the pages listed below, or by using the keyword search tool below to find specific information within the annual report.-
 1
1 -
2
-
3
-
4
-
5
-
6
-
7
-
8
-
9
-
10
-
11
-
12
-
13
-
14
-
15
-
16
-
17
-
18
-
19
-
20
-
21
-
22
-
23
-
24
-
25
-
26
-
27
-
28
-
29
-
30
-
31
-
32
-
33
-
34
-
35
-
36
-
37
-
38
-
39
-
40
-
 41
41 -
 42
42 -
 43
43 -
 44
44 -
 45
45 -
 46
46 -
 47
47 -
 48
48 -
 49
49 -
 50
50 -
 51
51 -
 52
52 -
 53
53 -
 54
54 -
 55
55 -
 56
56 -
 57
57 -
 58
58 -
 59
59 -
 60
60 -
 61
61 -
62
-
63
-
64
-
65
-
66
-
67
-
68
-
69
-
70
-
71
-
72
-
73
-
74
-
75
-
76
-
77
-
78
-
79
-
80
-
81
-
82
-
83
-
84
-
85
-
86
-
87
-
88
-
89
-
90
-
91
-
92
-
93
-
94
-
95
-
96
-
97
-
98
-
99
-
100
-
101
-
102
-
103
-
104
-
105
-
106
-
107
-
108
-
109
-
110
-
111
-
112
-
113
-
114
-
115
-
116
-
117
-
118
-
119
-
120
-
121
-
122
-
123
-
124
-
125
-
126
-
127
-
128
-
129
-
130
-
131
-
132
-
133
-
134
-
135
-
136
-
137
-
138
-
139
-
140
-
141
-
142
 |
 |

33
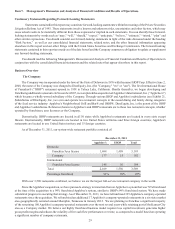
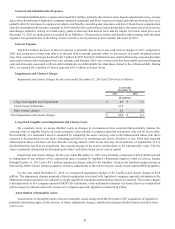
Significant Known Events, Trends or Uncertainties Impacting or Expected to Impact Comparisons of Reported or
Future Results
Current Economic Conditions
While Gross Domestic Product grew at a modest pace during 2011, we believe overhanging concerns about high levels of
unemployment and fluctuating levels of home foreclosures in addition to lower overall valuations for residential real estate and
rising gasoline prices may continue to temper consumer discretionary spending. A decline or lack of growth in disposable income
for discretionary spending could cause our customers to change historic purchasing behavior and choose lower-cost dining options
or alternatives to dining out. These factors could have an adverse effect on our business, results of operations and financial condition.
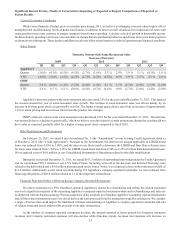
Sales Trends
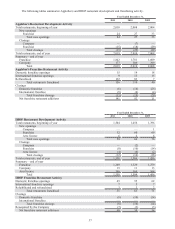
Applebee’s
Quarter
YTD
IHOP
Quarter
YTD
Domestic System-wide Same Restaurant Sales
Increase (Decrease)
2009
Q1
(3.0)%
(3.0)%
2.0 %
2.0 %
Q2
(4.3)%
(3.6)%
(0.6)%
0.7 %
Q3
(6.5)%
(4.5)%
(1.1)%
0.2 %
Q4
(4.5)%
(4.5)%
(3.1)%
(0.8)%
2010
Q1
(2.7)%
(2.7)%
(0.4)%
(0.4)%
Q2
(1.6)%
(2.2)%
(1.0)%
(0.7)%
Q3
3.3 %
(0.5)%
0.1 %
(0.4)%
Q4
2.9%
0.3%
1.1%
0.0%
2011
Q1
3.9 %
3.9 %
(2.7)%
(2.7)%
Q2
3.1 %
3.5 %
(2.9)%
(2.8)%
Q3
(0.3)%
2.3 %
(1.5)%
(2.4)%
Q4
1.0 %
2.0 %
(1.0)%
(2.0)%
Applebee’ s domestic system-wide same-restaurant sales increased 2.0% for the year ended December 31, 2011. This marked
the second consecutive year of same-restaurant sales growth. The increase in same-restaurant sales was driven mainly by an
increase in average guest check as guest traffic was flat. The higher average guest check came from an increase of approximately
1.4% in menu pricing and an increase from favorable product mix changes.
IHOP’ s domestic system-wide same-restaurant sales decreased 2.0% for the year ended December 31, 2011. The decrease
was primarily due to a decline in guest traffic, which we believe was due in part to certain promotions during the year that did not
drive sales as expected, partially offset by a higher average guest check compared to fiscal 2010.
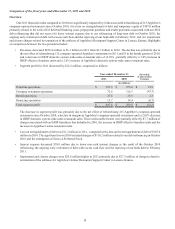
Debt Modification and Retirements
On February 25, 2011, we entered into Amendment No. 1 (the “Amendment”) to our existing Credit Agreement dated as
of October 8, 2010 (the “Credit Agreement”). Pursuant to the Amendment, the interest rate margin applicable to LIBOR-based
loans was reduced from 4.50% to 3.00%, and the interest rate floors used to determine the LIBOR and Base Rate reference rates
for loans were reduced from 1.50% to 1.25% for LIBOR-based loans and from 2.50% to 2.25% for Base Rate denominated loans.
We recognized costs of $4.0 million in our Consolidated Statements of Operations related to this debt modification.
During the year ended December 31, 2011, we repaid $161.5 million of outstanding borrowings under the Credit Agreement
and we repurchased $59.3 million of our 9.5% Senior Notes. Including write-off of the discount and deferred financing costs
related to the debt retired and a $4.9 million premium paid on the Senior Notes, we recognized a loss on the retirement of debt of
$11.2 million. Additionally, as the result of refranchising 132 Applebee’s company-operated restaurants, we were released from
financing obligations of $40.0 million related to 21 of the properties refranchised.
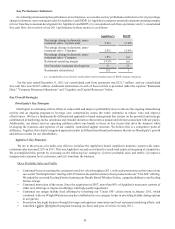
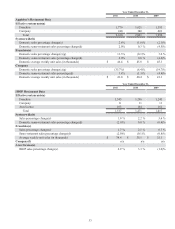
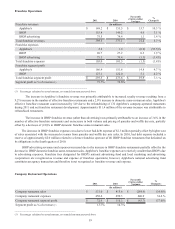
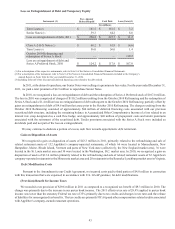
Financial Statement Effect of Refranchising Company-Operated Restaurants
We plan to transition to a 99% franchisee-operated Applebee's system by refranchising and selling the related restaurant
assets of a significant majority of the remaining Applebee’s company-operated restaurants when such refranchisings and sales are
in alignment with our business strategy. We may suspend or delay our plans to refranchise Applebee’s company-operated restaurants
and sell the related restaurant assets if we do not believe the sales proceeds from the transaction would be satisfactory. We consider
a range of factors that could impact the likelihood of future refranchising of Applebee’s company-operated restaurants and sale
of related restaurant assets and possible proceeds from such transactions.
As the number of company-operated restaurants declines, the amount reported in future periods for Company restaurant
revenues and Company restaurant expenses will also decline while franchise royalty revenues and expenses will increase, as