IHOP 2011 Annual Report Download - page 59
Download and view the complete annual report
Please find page 59 of the 2011 IHOP annual report below. You can navigate through the pages in the report by either clicking on the pages listed below, or by using the keyword search tool below to find specific information within the annual report.-
 1
1 -
2
-
3
-
4
-
5
-
6
-
7
-
8
-
9
-
10
-
11
-
12
-
13
-
14
-
15
-
16
-
17
-
18
-
19
-
20
-
21
-
22
-
23
-
24
-
25
-
26
-
27
-
28
-
29
-
30
-
31
-
32
-
33
-
34
-
35
-
36
-
37
-
38
-
39
-
40
-
41
-
42
-
43
-
44
-
45
-
46
-
47
-
48
-
 49
49 -
 50
50 -
 51
51 -
 52
52 -
 53
53 -
 54
54 -
 55
55 -
 56
56 -
 57
57 -
 58
58 -
 59
59 -
 60
60 -
 61
61 -
 62
62 -
 63
63 -
 64
64 -
 65
65 -
 66
66 -
 67
67 -
 68
68 -
 69
69 -
70
-
71
-
72
-
73
-
74
-
75
-
76
-
77
-
78
-
79
-
80
-
81
-
82
-
83
-
84
-
85
-
86
-
87
-
88
-
89
-
90
-
91
-
92
-
93
-
94
-
95
-
96
-
97
-
98
-
99
-
100
-
101
-
102
-
103
-
104
-
105
-
106
-
107
-
108
-
109
-
110
-
111
-
112
-
113
-
114
-
115
-
116
-
117
-
118
-
119
-
120
-
121
-
122
-
123
-
124
-
125
-
126
-
127
-
128
-
129
-
130
-
131
-
132
-
133
-
134
-
135
-
136
-
137
-
138
-
139
-
140
-
141
-
142
 |
 |

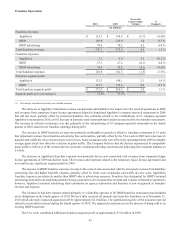
41
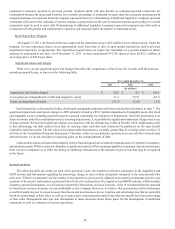
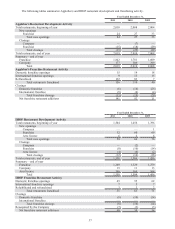
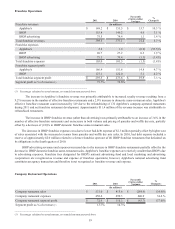
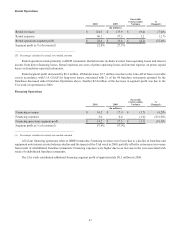
Rental operations relate primarily to IHOP restaurants. Rental revenue includes income from operating leases and interest
income from direct financing leases. Rental expenses are costs of prime operating leases and interest expense on prime capital
leases on franchisee-operated restaurants.
Rental segment profit increased by $2.3 million primarily due to charges related to a franchisee default in 2010 that did not
recur in 2011. Segment profit in 2010 was adversely impacted by $5.7 million because of the write-off of deferred lease costs
associated with 21 of the 40 franchise restaurants operated by a former franchise operator that defaulted on its obligations in the
fourth quarter of 2010. This favorable effect on the comparison of 2011 with 2010 was partially offset by lower rent on refranchised
properties and the unfavorable impact on sales-based rent of the (2.0%) decline in IHOP's domestic franchise same-restaurant
sales in 2011.
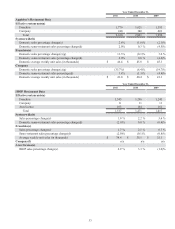
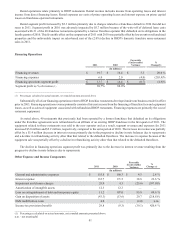
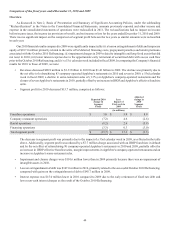
Financing Operations
Financing revenues
Financing expenses
Financing operations segment profit
Segment profit as % of revenue (1)
2011
(In millions)
$ 19.7
6.0
$ 13.7
69.7%
2010
$ 16.4
2.0
$ 14.4
88.0%
Favorable
(Unfavorable)
Variance
$ 3.3
(4.0)
$(0.7)
%
Change(1)
20.0 %
(203.4)%
(4.9)%
________________________________________
(1) Percentages calculated on actual amounts, not rounded amounts presented above
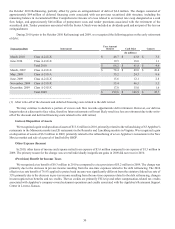
Substantially all of our financing operations relate to IHOP franchise restaurants developed under our business model in effect
prior to 2003. Financing operations revenue primarily consists of interest income from the financing of franchise fees and equipment
leases, as well as sales of equipment associated with refranchised IHOP restaurants. Financing expenses are primarily the cost of
restaurant equipment.
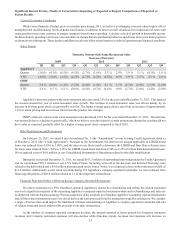
As noted above, 40 restaurants that previously had been operated by a former franchisee that defaulted on its obligations
under the franchise agreements were refranchised to an affiliate of an existing IHOP franchisee in the first quarter of 2011. The
equipment related to those restaurants was sold to the new operator and as a result, segment revenues and expenses for 2011
increased $5.0 million and $5.2 million, respectively, compared to the same period of 2010. The increase in revenue was partially
offset by a $1.4 million decrease in interest revenue primarily due to the progressive decline in note balances due to repayments
and a decline in refranchising activity other than that related to the defaulted franchisee. The increase in expense because of the
equipment sale was partially offset by a decline in refranchising activity other than that related to the defaulted franchisee.
The decline in financing operations segment profit was primarily due to the decrease in interest revenue resulting from the
progressive decline in note balances due to repayments.
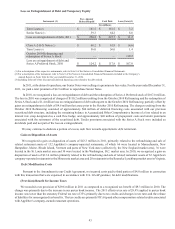
Other Expense and Income Components
General and administrative expenses
Interest expense
Impairment and closure charges
Amortization of intangible assets
Loss on extinguishment of debt and temporary equity
Gain on disposition of assets
Debt modification costs
Income tax provision (benefit)
2011
(In millions)
$ 155.8
132.7
29.9
12.3
11.2
(43.3)
4.0
29.8
2010
$ 160.3
171.5
4.3
12.3
107.0
(13.6)
—
(9.3)
Favorable
(Unfavorable)
Variance
$ 4.5
38.8
(25.6)
—
95.8
29.7
(4.0)
(39.1)
%
Change (1)
2.8 %
22.6 %
(597.0)%
—
89.6 %
(218.6)%
n.m.
420.8 %
__________________________________________
(1) Percentages calculated on actual amounts, not rounded amounts presented above
n.m. - not meaningful