IHOP 2011 Annual Report Download - page 109
Download and view the complete annual report
Please find page 109 of the 2011 IHOP annual report below. You can navigate through the pages in the report by either clicking on the pages listed below, or by using the keyword search tool below to find specific information within the annual report.-
 1
1 -
2
-
3
-
4
-
5
-
6
-
7
-
8
-
9
-
10
-
11
-
12
-
13
-
14
-
15
-
16
-
17
-
18
-
19
-
20
-
21
-
22
-
23
-
24
-
25
-
26
-
27
-
28
-
29
-
30
-
31
-
32
-
33
-
34
-
35
-
36
-
37
-
38
-
39
-
40
-
41
-
42
-
43
-
44
-
45
-
46
-
47
-
48
-
49
-
50
-
51
-
52
-
53
-
54
-
55
-
56
-
57
-
58
-
59
-
60
-
61
-
62
-
63
-
64
-
65
-
66
-
67
-
68
-
69
-
70
-
71
-
72
-
73
-
74
-
75
-
76
-
77
-
78
-
79
-
80
-
81
-
82
-
83
-
84
-
85
-
86
-
87
-
88
-
89
-
90
-
91
-
92
-
93
-
94
-
95
-
96
-
97
-
98
-
 99
99 -
 100
100 -
 101
101 -
 102
102 -
 103
103 -
 104
104 -
 105
105 -
 106
106 -
 107
107 -
 108
108 -
 109
109 -
 110
110 -
 111
111 -
 112
112 -
 113
113 -
 114
114 -
 115
115 -
 116
116 -
 117
117 -
 118
118 -
 119
119 -
120
-
121
-
122
-
123
-
124
-
125
-
126
-
127
-
128
-
129
-
130
-
131
-
132
-
133
-
134
-
135
-
136
-
137
-
138
-
139
-
140
-
141
-
142
 |
 |
DineEquity, Inc. and Subsidiaries
Notes to the Consolidated Financial Statements (Continued)
18. Stock-Based Incentive Plans (Continued)
91
Risk free interest rate
Weighted average historical volatility
Dividend yield
Expected years until exercise
Forfeitures
2011
1.8%
79.1%
—%
4.6
11.0%
2010
2.2%
80.4%
—%
4.8
11.0%
2009
2.0%
72.3%
—%
5.0
11.0%
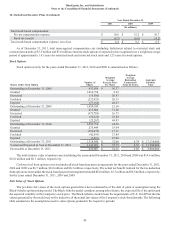
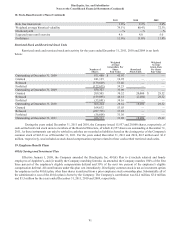
Restricted Stock and Restricted Stock Units
Restricted stock and restricted stock unit activity for the years ended December 31, 2011, 2010 and 2009 is set forth
below:
Outstanding at December 31, 2008
Granted
Released
Forfeited
Outstanding at December 31, 2009
Granted
Released
Forfeited
Outstanding at December 31, 2010
Granted
Released
Forfeited
Outstanding at December 31, 2011
Number of
Shares
671,480
241,125
(139,649)
(122,633)
650,323
209,505
(159,893)
(33,691)
666,244
164,632
(287,735)
(56,608)
486,533
Weighted
Average
Grant-Date Per
Share
Fair Value
$ 45.07
10.92
51.40
34.23
33.09
30.52
48.18
34.16
28.62
53.03
37.82
31.56
31.08
Restricted
Stock Units
—
—
—
—
—
20,000
(2,000)
—
18,000
—
—
—
18,000
Weighted
Average
Grant-Date
Per Share
Fair Value
—
—
—
—
—
$ 29.32
29.32
—
29.32
—
—
—
29.32
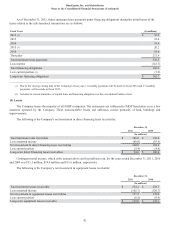
During the years ended December 31, 2011 and 2010, the Company issued 15,957 and 29,000 shares, respectively, of
cash-settled restricted stock units to members of the Board of Directors, of which 41,957 shares are outstanding at December 31,
2011. As these instruments can only be settled in cash they are recorded as liabilities based on the closing price of the Company's
common stock of $42.21 as of December 31, 2011. For the years ended December 31, 2011 and 2010, $0.5 million and $1.2
million, respectively, was included as stock-based compensation expense related to these cash-settled restricted stock units.
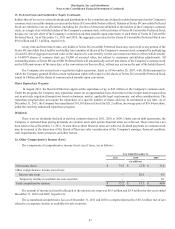
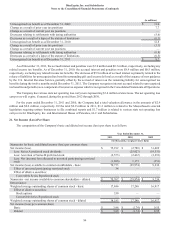
19. Employee Benefit Plans
401(k) Savings and Investment Plan
Effective January 1, 2009, the Company amended the DineEquity, Inc. 401(k) Plan to (i) include salaried and hourly
employees of Applebee's, and (ii) modify the Company matching formula. As amended, the Company matches 100% of the first
three percent of the employee's eligible compensation deferral and 50% of the next two percent of the employee's eligible
compensation deferral. All contributions under this plan vest immediately. DineEquity common stock is not an investment option
for employees in the 401(k) plan, other than shares transferred from a prior employee stock ownership plan. Substantially all of
the administrative cost of the 401(k) plan is borne by the Company. The Company's contribution was $2.4 million, $3.0 million
and $3.5 million for the years ended December 31, 2011, 2010 and 2009, respectively.