IHOP 2011 Annual Report Download - page 60
Download and view the complete annual report
Please find page 60 of the 2011 IHOP annual report below. You can navigate through the pages in the report by either clicking on the pages listed below, or by using the keyword search tool below to find specific information within the annual report.-
 1
1 -
2
-
3
-
4
-
5
-
6
-
7
-
8
-
9
-
10
-
11
-
12
-
13
-
14
-
15
-
16
-
17
-
18
-
19
-
20
-
21
-
22
-
23
-
24
-
25
-
26
-
27
-
28
-
29
-
30
-
31
-
32
-
33
-
34
-
35
-
36
-
37
-
38
-
39
-
40
-
41
-
42
-
43
-
44
-
45
-
46
-
47
-
48
-
49
-
 50
50 -
 51
51 -
 52
52 -
 53
53 -
 54
54 -
 55
55 -
 56
56 -
 57
57 -
 58
58 -
 59
59 -
 60
60 -
 61
61 -
 62
62 -
 63
63 -
 64
64 -
 65
65 -
 66
66 -
 67
67 -
 68
68 -
 69
69 -
 70
70 -
71
-
72
-
73
-
74
-
75
-
76
-
77
-
78
-
79
-
80
-
81
-
82
-
83
-
84
-
85
-
86
-
87
-
88
-
89
-
90
-
91
-
92
-
93
-
94
-
95
-
96
-
97
-
98
-
99
-
100
-
101
-
102
-
103
-
104
-
105
-
106
-
107
-
108
-
109
-
110
-
111
-
112
-
113
-
114
-
115
-
116
-
117
-
118
-
119
-
120
-
121
-
122
-
123
-
124
-
125
-
126
-
127
-
128
-
129
-
130
-
131
-
132
-
133
-
134
-
135
-
136
-
137
-
138
-
139
-
140
-
141
-
142
 |
 |

42
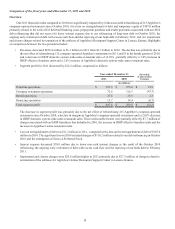
General and Administrative Expenses
General and administrative expenses decreased $4.5 million, primarily due to lower stock-based compensation costs, savings
due to the refranchising of Applebee's company-operated restaurants and lower expenses for legal and other professional services,
partially offset by increases in expenses for salaries and benefits, recruiting and relocation, and travel. Stock-based compensation
costs decreased primarily because expenses in 2010 related to the acceleration of equity grants due to the retirement of an executive
and changes related to vesting of certain equity grants to directors that did not recur and the impact of a lower stock price as of
December 31, 2011 on equity grants accounted for as liabilities. The increase in salaries and benefits and recruiting and relocation
expenses was primarily due to the hiring of more executive level positions in 2011 and the latter part of 2010.
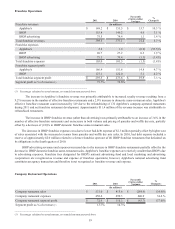
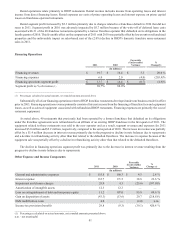
Interest Expense
The $38.8 million decrease in interest expense is primarily due to lower non-cash interest charges in 2011 compared to
2010 and a reduction in long-term debt over the past twelve months, partially offset by an increase in overall weighted interest
rates. Non-cash interest charges declined to $6.2 million in 2011 from $34.4 million because deferred financing costs and discounts
associated with our debt instruments that were refinanced in October 2010 were written off at that time and the deferred financing
costs and discounts associated with new debt instruments are substantially less than those related to the refinanced debt. During
2011, we repaid $161.5 million of Term Loans and $59.3 million of Senior Notes.
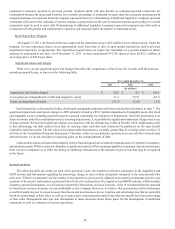
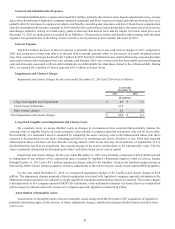
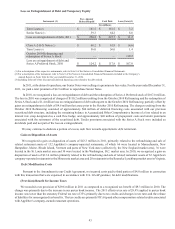
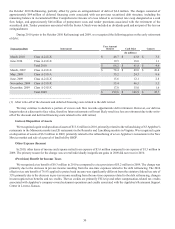
Impairment and Closure Charges
Impairment and closure charges for the years ended December 31, 2011 and 2010 were as follows:
Long-lived tangible asset impairment
Lenexa lease termination
Other closure charges
Total impairment and closure charges
Year Ended
December 31,
2011
(In millions)
$ 4.9
23.0
2.0
$ 29.9
2010
$ 1.5
—
2.8
$ 4.3
Long-lived Tangible Asset Impairment and Closure Costs
On a quarterly basis, we assess whether events or changes in circumstances have occurred that potentially indicate the
carrying value of tangible long-lived assets, primarily assets related to company-operated restaurants, may not be recoverable.
Recoverability of a restaurant's assets is measured by comparing the assets' carrying value to the undiscounted future cash flows
expected to be generated over the assets' remaining useful lives or remaining lease terms, whichever is less. If the total expected
undiscounted future cash flows are less than the carrying amount of the assets, this may be an indicator of impairment. If it is
decided that there has been an impairment, the carrying amount of the asset is written down to the estimated fair value. The fair
value is primarily determined by discounting the future cash flows based on our cost of capital.
Impairment and closure charges for the year ended December 31, 2011 were primarily comprised of $23.0 million related
to termination of our sublease of the commercial space occupied by Applebee’s Restaurant Support Center in Lenexa, Kansas
through October 31, 2011 and a $4.5 million impairment charge related to the furniture, fixtures and leasehold improvements at
that facility. Other closure charges primarily related to adjustments to the reserve for previously closed surplus IHOP properties.
For the year ended December 31, 2010, we recognized impairment charges of $1.5 million and closure charges of $2.8
million. The impairment charges primarily related to properties associated with Applebee's company-operated restaurants in the
Minnesota market expected to be sold and to a single Applebee's restaurant and the land on which it is situated. The closure charges
related primarily to two company-operated IHOP Cafe restaurants, a non-traditional restaurant test format that was evaluated but
will no longer be utilized, and to the closure of a company-operated Applebee's restaurant in China.
Amortization of Intangible Assets
Amortization of intangible assets relates to intangible assets arising from the November 2007 acquisition of Applebee's,
primarily franchising rights. In the absence of future impairment charges, amortization charges should remain consistent from
year to year.