IHOP 2011 Annual Report Download - page 108
Download and view the complete annual report
Please find page 108 of the 2011 IHOP annual report below. You can navigate through the pages in the report by either clicking on the pages listed below, or by using the keyword search tool below to find specific information within the annual report.-
 1
1 -
2
-
3
-
4
-
5
-
6
-
7
-
8
-
9
-
10
-
11
-
12
-
13
-
14
-
15
-
16
-
17
-
18
-
19
-
20
-
21
-
22
-
23
-
24
-
25
-
26
-
27
-
28
-
29
-
30
-
31
-
32
-
33
-
34
-
35
-
36
-
37
-
38
-
39
-
40
-
41
-
42
-
43
-
44
-
45
-
46
-
47
-
48
-
49
-
50
-
51
-
52
-
53
-
54
-
55
-
56
-
57
-
58
-
59
-
60
-
61
-
62
-
63
-
64
-
65
-
66
-
67
-
68
-
69
-
70
-
71
-
72
-
73
-
74
-
75
-
76
-
77
-
78
-
79
-
80
-
81
-
82
-
83
-
84
-
85
-
86
-
87
-
88
-
89
-
90
-
91
-
92
-
93
-
94
-
95
-
96
-
97
-
 98
98 -
 99
99 -
 100
100 -
 101
101 -
 102
102 -
 103
103 -
 104
104 -
 105
105 -
 106
106 -
 107
107 -
 108
108 -
 109
109 -
 110
110 -
 111
111 -
 112
112 -
 113
113 -
 114
114 -
 115
115 -
 116
116 -
 117
117 -
 118
118 -
119
-
120
-
121
-
122
-
123
-
124
-
125
-
126
-
127
-
128
-
129
-
130
-
131
-
132
-
133
-
134
-
135
-
136
-
137
-
138
-
139
-
140
-
141
-
142
 |
 |

DineEquity, Inc. and Subsidiaries
Notes to the Consolidated Financial Statements (Continued)
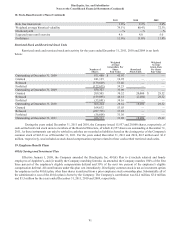
18. Stock-Based Incentive Plans (Continued)
90
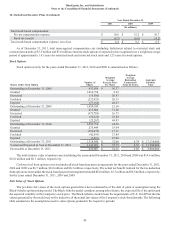
Total stock-based compensation:
Pre-tax compensation expense
Book tax benefit
Total stock-based compensation expense, net of tax
Year Ended December 31,
2011
(In millions)
$ 10.6
(4.2)
$ 6.4
2010
$ 15.2
(6.0)
$ 9.2
2009
$ 10.7
(4.2)
$ 6.5
As of December 31, 2011, total unrecognized compensation cost (including forfeitures) related to restricted stock and
restricted stock units of $7.5 million and $7.6 million related to stock options is expected to be recognized over a weighted average
period of approximately 1.43 years for restricted stock and restricted stock units and 1.23 years for stock options.
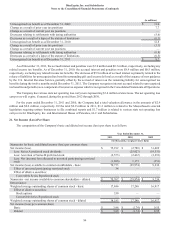
Stock Options
Stock option activity for the years ended December 31, 2011, 2010 and 2009 is summarized as follows:
Shares Under Stock Option
Outstanding at December 31, 2008
Granted
Exercised
Forfeited
Expired
Outstanding at December 31, 2009
Granted
Exercised
Forfeited
Expired
Outstanding at December 31, 2010
Granted
Exercised
Forfeited
Expired
Outstanding at December 31, 2011
Vested and Expected to Vest at December 31, 2011
Exercisable at December 31, 2011
Number of
Shares
933,939
1,016,750
(15,500)
(222,923)
(53,166)
1,659,100
415,804
(475,705)
(50,222)
(25,267)
1,523,710
233,449
(393,075)
(42,593)
(2,851)
1,318,640
1,143,491
620,687
Weighted
Average
Exercise Price
Per Share
$ 36.37
8.22
20.87
20.35
40.07
21.30
31.26
16.75
25.84
44.93
24.90
53.04
17.11
27.89
47.08
$ 32.06
$ 32.75
$ 34.21
Weighted
Average
Remaining
Contractual
Term (in Years)
6.74
6.53
5.07
Aggregate
Intrinsic
Value
$ 17,110,000
$ 13,980,000
$ 5,980,000
The total intrinsic value of options exercised during the years ended December 31, 2011, 2010 and 2009 was $14.6 million,
$12.0 million and $0.1 million, respectively.
Cash received from options exercised under all stock-based payment arrangements for the years ended December 31, 2011,
2010 and 2009 was $6.7 million, $8.0 million and $0.3 million, respectively. The actual tax benefit realized for the tax deduction
from option exercises under the stock-based payment arrangements totaled $6.0 million, $2.7 million and $0.5 million, respectively,
for the years ended December 31, 2011, 2010 and 2009.
Fair Value of Stock Options
The per share fair values of the stock options granted have been estimated as of the date of grant or assumption using the
Black-Scholes option pricing model. The Black-Scholes model considers, among other factors, the expected life of the option and
the expected volatility of the Company's stock price. The Black-Scholes model meets the requirements of U.S. GAAP but the fair
values generated by the model may not be indicative of the actual fair values of the Company's stock-based awards. The following
table summarizes the assumptions used to value options granted in the respective periods: