IHOP 2011 Annual Report Download - page 83
Download and view the complete annual report
Please find page 83 of the 2011 IHOP annual report below. You can navigate through the pages in the report by either clicking on the pages listed below, or by using the keyword search tool below to find specific information within the annual report.-
 1
1 -
2
-
3
-
4
-
5
-
6
-
7
-
8
-
9
-
10
-
11
-
12
-
13
-
14
-
15
-
16
-
17
-
18
-
19
-
20
-
21
-
22
-
23
-
24
-
25
-
26
-
27
-
28
-
29
-
30
-
31
-
32
-
33
-
34
-
35
-
36
-
37
-
38
-
39
-
40
-
41
-
42
-
43
-
44
-
45
-
46
-
47
-
48
-
49
-
50
-
51
-
52
-
53
-
54
-
55
-
56
-
57
-
58
-
59
-
60
-
61
-
62
-
63
-
64
-
65
-
66
-
67
-
68
-
69
-
70
-
71
-
72
-
 73
73 -
 74
74 -
 75
75 -
 76
76 -
 77
77 -
 78
78 -
 79
79 -
 80
80 -
 81
81 -
 82
82 -
 83
83 -
 84
84 -
 85
85 -
 86
86 -
 87
87 -
 88
88 -
 89
89 -
 90
90 -
 91
91 -
 92
92 -
 93
93 -
94
-
95
-
96
-
97
-
98
-
99
-
100
-
101
-
102
-
103
-
104
-
105
-
106
-
107
-
108
-
109
-
110
-
111
-
112
-
113
-
114
-
115
-
116
-
117
-
118
-
119
-
120
-
121
-
122
-
123
-
124
-
125
-
126
-
127
-
128
-
129
-
130
-
131
-
132
-
133
-
134
-
135
-
136
-
137
-
138
-
139
-
140
-
141
-
142
 |
 |

65
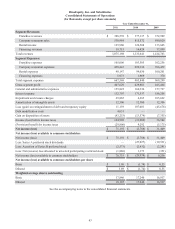
DineEquity, Inc. and Subsidiaries
Consolidated Statements of Cash Flows
(In thousands)
Cash flows from operating activities
Net income (loss)
Adjustments to reconcile net income (loss) to cash flows provided by
operating activities
Depreciation and amortization
Non-cash interest expense
Loss (gain) on extinguishment of debt and temporary equity
Impairment and closure charges
Deferred income taxes
Non-cash stock-based compensation expense
Tax benefit from stock-based compensation
Excess tax benefit from stock options exercised
Gain on disposition of assets
Other
Changes in operating assets and liabilities:
Receivables
Inventories
Prepaid expenses
Current income tax receivables and payables
Accounts payable
Accrued employee compensation and benefits
Gift card liability
Other accrued expenses
Cash flows provided by operating activities
Cash flows from investing activities
Additions to property and equipment
Proceeds from sale of property and equipment and assets held for sale
Principal receipts from notes, equipment contracts and other long-
term receivables
Other
Cash flows provided by investing activities
Cash flows from financing activities
Borrowings under revolving credit facilities
Repayments under revolving credit facilities
Proceeds from issuance of long-term debt
Repayment of long-term debt (including tender premiums)
Purchase of DineEquity common stock
Redemption of Series A Preferred Stock
Payment of debt issuance costs
Principal payments on capital lease and financing obligations
Dividends paid (including Series A redemption premiums)
Repurchase of restricted stock
Proceeds from stock options exercised
Excess tax benefit from stock options exercised
Change in restricted cash
Other
Cash flows used in financing activities
Net change in cash and cash equivalents
Cash and cash equivalents at beginning of year
Cash and cash equivalents at end of year
Supplemental disclosures
Interest paid
Income taxes paid
Year Ended December 31,
2011
$ 75,192
50,220
6,160
11,159
8,448
11,835
9,492
6,494
(5,443)
(43,253)
(1,765)
(16,722)
(3,723)
(1,631)
20,479
(3,533)
(6,656)
21,983
(17,050)
121,686
(26,332)
115,642
13,122
(753)
101,679
40,000
(40,000)
—
(225,681)
(21,170)
—
(12,295)
(13,391)
—
(5,080)
6,725
5,443
466
—
(264,983)
(41,618)
102,309
$ 60,691
$ 148,982
$ 24,139
2010
$ (2,788)
61,427
34,379
107,003
3,482
(15,484)
13,085
2,692
(4,775)
(13,574)
5,431
3,736
(263)
(9,148)
(27,703)
27
(5,000)
19,507
7,248
179,282
(18,677)
51,642
19,452
1,087
53,504
—
—
1,725,000
(1,777,946)
—
(190,000)
(57,602)
(16,118)
(26,117)
(1,884)
7,968
4,775
119,133
—
(212,791)
19,995
82,314
$ 102,309
$ 141,139
$ 33,389
2009
$ 31,409
65,379
39,422
(45,678)
105,094
(19,875)
10,710
531
(48)
(7,355)
(5,408)
11,607
(1,474)
(15,947)
5,001
(14,867)
(8,119)
7,180
286
157,848
(15,372)
15,777
17,553
877
18,835
10,000
—
—
(173,777)
—
—
(20,300)
(16,160)
(24,091)
(605)
324
48
15,878
(129)
(208,812)
(32,129)
114,443
$ 82,314
$ 166,361
$ 31,245
See the accompanying notes to the consolidated financial statements.