IHOP 2011 Annual Report Download - page 63
Download and view the complete annual report
Please find page 63 of the 2011 IHOP annual report below. You can navigate through the pages in the report by either clicking on the pages listed below, or by using the keyword search tool below to find specific information within the annual report.-
 1
1 -
2
-
3
-
4
-
5
-
6
-
7
-
8
-
9
-
10
-
11
-
12
-
13
-
14
-
15
-
16
-
17
-
18
-
19
-
20
-
21
-
22
-
23
-
24
-
25
-
26
-
27
-
28
-
29
-
30
-
31
-
32
-
33
-
34
-
35
-
36
-
37
-
38
-
39
-
40
-
41
-
42
-
43
-
44
-
45
-
46
-
47
-
48
-
49
-
50
-
51
-
52
-
 53
53 -
 54
54 -
 55
55 -
 56
56 -
 57
57 -
 58
58 -
 59
59 -
 60
60 -
 61
61 -
 62
62 -
 63
63 -
 64
64 -
 65
65 -
 66
66 -
 67
67 -
 68
68 -
 69
69 -
 70
70 -
 71
71 -
 72
72 -
 73
73 -
74
-
75
-
76
-
77
-
78
-
79
-
80
-
81
-
82
-
83
-
84
-
85
-
86
-
87
-
88
-
89
-
90
-
91
-
92
-
93
-
94
-
95
-
96
-
97
-
98
-
99
-
100
-
101
-
102
-
103
-
104
-
105
-
106
-
107
-
108
-
109
-
110
-
111
-
112
-
113
-
114
-
115
-
116
-
117
-
118
-
119
-
120
-
121
-
122
-
123
-
124
-
125
-
126
-
127
-
128
-
129
-
130
-
131
-
132
-
133
-
134
-
135
-
136
-
137
-
138
-
139
-
140
-
141
-
142
 |
 |

45
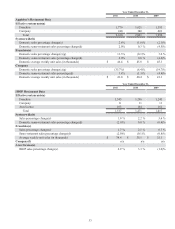
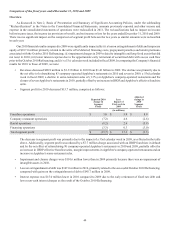
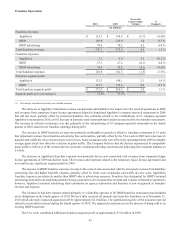
Franchise Operations
Franchise revenues
Applebee's
IHOP
IHOP advertising
Total franchise revenues
Franchise expenses
Applebee's
IHOP
IHOP advertising
Total franchise expenses
Franchise segment profit
Applebee's
IHOP
Total franchise segment profit
Segment profit as % of revenue(1)
2010
(In millions)
$ 153.3
149.0
74.4
376.7
2.1
27.3
74.4
103.8
151.2
121.7
$ 272.9
72.4%
2009
$ 154.0
148.0
70.2
372.2
4.9
27.2
70.2
102.3
149.1
120.8
$ 269.9
72.5%
Favorable
(Unfavorable)
Variance
$(0.7)
1.0
4.2
4.5
2.8
(0.1)
(4.2)
(1.5)
2.1
0.9
$ 3.0
%
Change(1)
(0.4)%
0.7 %
6.0 %
1.2 %
56.1 %
0.4 %
(6.0)%
(1.5)%
1.4 %
0.7 %
1.1 %
_________________________________________________
(1) Percentages calculated on actual, not rounded, amounts
The decrease in Applebee's franchise revenues was primarily attributable to the impact of a 53rd week of operations in 2009
and revenues from temporary liquor license agreements related to franchised Applebee's company-operated restaurants in 2009
that did not recur, partially offset by increased franchise fees primarily related to the refranchising of 83 company-operated
Applebee's restaurants in 2010, a 0.6% increase in domestic same-restaurant sales and an increase in effective franchise restaurants.
The increase in effective restaurants was due primarily to the refranchising of 83 company-operated restaurants in the fourth
quarter of 2010 and nine net franchise openings during 2010.
The increase in IHOP franchise revenue was primarily attributable to growth in effective franchise restaurants of 51 units
that impacted revenues from franchise advertising fees and royalties, partially offset by the 53rd week in 2009 and a decrease in
pancake and waffle dry mix revenues due to lower prices. Same-restaurant sales were effectively unchanged from 2009 as a higher
average guest check was offset by a decline in guest traffic. The Company believes that the decline experienced in comparable
guest traffic is reflective of the current adverse economic conditions affecting customers and impacting the restaurant industry as
a whole.
The decrease in Applebee's franchise expenses was primarily due to costs associated with revenues from temporary liquor
license agreements in 2009 that did not recur. The revenues and expenses related to the temporary liquor license agreements did
not result in any significant segment profit in 2009.
The increase in IHOP franchise expenses was due to the costs of sales associated with the increased revenues from franchise
advertising fees and higher bad debt expense, partially offset by lower costs of pancake and waffle dry mix sales. Applebee's
franchise expenses are relatively smaller than IHOP's due to advertising expenses. Franchise fees designated for IHOP's national
advertising fund and local marketing and advertising cooperatives are recognized as revenue and expense of franchise operations;
however, Applebee's national advertising fund constitutes an agency transaction and therefore is not recognized as franchise
revenue and expense.
The increase in bad debt expense related primarily to a franchise operator of 40 IHOP franchise restaurants that defaulted
on its obligations in the fourth quarter of 2010. We have fully reserved all amounts due from this franchisee as of December 31,
2010 which adversely impacted segment profit by approximately $2.0 million. The significant majority of the amounts reserved
related to receivables incurred during the fourth quarter of 2010. The impacted restaurants are in the process of being sold to an
existing IHOP franchisee.
The 53rd week contributed additional franchise segment profit of approximately $5.9 million in 2009.