IHOP 2011 Annual Report Download - page 58
Download and view the complete annual report
Please find page 58 of the 2011 IHOP annual report below. You can navigate through the pages in the report by either clicking on the pages listed below, or by using the keyword search tool below to find specific information within the annual report.-
 1
1 -
2
-
3
-
4
-
5
-
6
-
7
-
8
-
9
-
10
-
11
-
12
-
13
-
14
-
15
-
16
-
17
-
18
-
19
-
20
-
21
-
22
-
23
-
24
-
25
-
26
-
27
-
28
-
29
-
30
-
31
-
32
-
33
-
34
-
35
-
36
-
37
-
38
-
39
-
40
-
41
-
42
-
43
-
44
-
45
-
46
-
47
-
 48
48 -
 49
49 -
 50
50 -
 51
51 -
 52
52 -
 53
53 -
 54
54 -
 55
55 -
 56
56 -
 57
57 -
 58
58 -
 59
59 -
 60
60 -
 61
61 -
 62
62 -
 63
63 -
 64
64 -
 65
65 -
 66
66 -
 67
67 -
 68
68 -
69
-
70
-
71
-
72
-
73
-
74
-
75
-
76
-
77
-
78
-
79
-
80
-
81
-
82
-
83
-
84
-
85
-
86
-
87
-
88
-
89
-
90
-
91
-
92
-
93
-
94
-
95
-
96
-
97
-
98
-
99
-
100
-
101
-
102
-
103
-
104
-
105
-
106
-
107
-
108
-
109
-
110
-
111
-
112
-
113
-
114
-
115
-
116
-
117
-
118
-
119
-
120
-
121
-
122
-
123
-
124
-
125
-
126
-
127
-
128
-
129
-
130
-
131
-
132
-
133
-
134
-
135
-
136
-
137
-
138
-
139
-
140
-
141
-
142
 |
 |

40
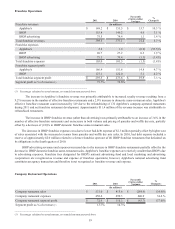
As of December 31, 2011, Company restaurant operations were comprised of 177 Applebee's company-operated restaurants
and 15 IHOP company-operated restaurants. The impact of the IHOP restaurants on all comparisons of fiscal 2011 with the same
period of 2010 was negligible.
Company restaurant sales decreased $284.6 million. In the past 15 months Applebee's refranchised 215 company-operated
restaurants (132 during 2011 and 83 in the fourth quarter of 2010) and closed seven company-operated restaurants during 2010.
As a result, Applebee's company restaurant sales declined $292.7 million, partially offset by a $6.9 million increase in revenue
from currently operating restaurants, which represents a 1.8% increase in company same-restaurant sales. The increase in same-
restaurant sales was driven mainly by an increase in average guest check that resulted from an increase of approximately 1.4% in
menu pricing and an increase from favorable product mix changes. Traffic was flat compared to the prior year.
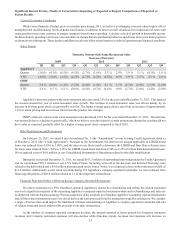
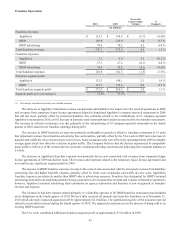
Company restaurant expenses declined $240.9 million. Applebee's company restaurant expenses declined $253.3 million
because of the refranchising of company-operated restaurants and closures noted above, partially offset by an increase of $11.1
million in costs at currently operating restaurants. The overall operating margin for Applebee's company restaurant operations
declined to 14.5% for 2011 from 14.8% for the same period of last year, as shown below:
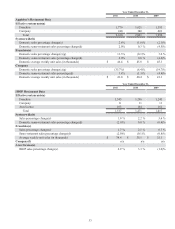
Applebee's Company-operated Expenses
As Percentage of Restaurant Sales
Revenue
Food and beverage
Labor
Direct and occupancy
Restaurant Operating Profit Margin (a)
Year Ended
December 31,
2011
100.0%
25.7%
32.7%
27.1%
14.5%
2010
100.0%
25.5%
33.2%
26.6%
14.8%
Favorable (Unfavorable)
Total
Variance
(0.2)%
0.5 %
(0.6)%
(0.3)%
Components of Total Variance
Refranchising
and Closures
0.0%
1.1%
0.0%
1.1%
Current
Restaurants
(0.2)%
(0.6)%
(0.5)%
(1.4)%
_________________________________________
(a) Percentages may not add due to rounding.
The restaurant refranchising and closures noted above had a net favorable impact of 1.1% on restaurant operating profit
margin, primarily because the markets refranchised had higher-than-average labor costs. In terms of specific cost categories at
currently operating company restaurants:
• Food and beverage costs as a percentage of company restaurant sales increased 0.2%, primarily due to a 3.2% increase
in overall commodity costs (primarily produce, poultry, seafood and dairy) as well as menu changes, partially offset by
improvement in waste variances and savings associated with distribution center realignment.
• Labor costs as a percentage of restaurant sales increased 0.6% due to higher payroll-related costs, increased management
staffing levels and salaries, partially offset by decreased use of hourly shift supervisors and lower bonus costs. Payroll-
related costs increased because of the expiration of Hire Act FICA credits along with higher costs of workers compensation
insurance and hourly vacation expense.
• Direct and occupancy costs as a percentage of company restaurant sales increased 0.5% due to incremental investment
in local advertising, higher rates for both natural gas and electricity and higher facilities expenses.
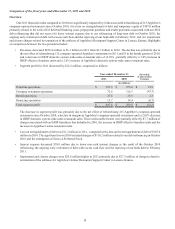
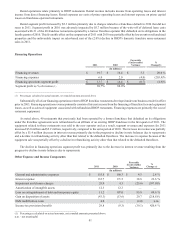
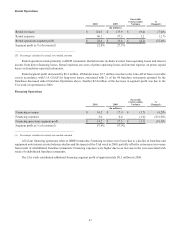
Rental Operations
Rental revenues
Rental expenses
Rental operations segment profit
Segment profit as % of revenue(1)
2011
(In millions)
$ 126.0
98.2
$ 27.8
22.1%
2010
$ 124.5
99.0
$ 25.5
20.5%
Favorable
(Unfavorable)
Variance
$ 1.5
0.8
$ 2.3
%
Change (1)
1.2%
0.9%
9.2%
_________________________________________
(1) Percentages calculated on actual amounts, not rounded amounts presented above