IHOP 2011 Annual Report Download - page 53
Download and view the complete annual report
Please find page 53 of the 2011 IHOP annual report below. You can navigate through the pages in the report by either clicking on the pages listed below, or by using the keyword search tool below to find specific information within the annual report.-
 1
1 -
2
-
3
-
4
-
5
-
6
-
7
-
8
-
9
-
10
-
11
-
12
-
13
-
14
-
15
-
16
-
17
-
18
-
19
-
20
-
21
-
22
-
23
-
24
-
25
-
26
-
27
-
28
-
29
-
30
-
31
-
32
-
33
-
34
-
35
-
36
-
37
-
38
-
39
-
40
-
41
-
42
-
 43
43 -
 44
44 -
 45
45 -
 46
46 -
 47
47 -
 48
48 -
 49
49 -
 50
50 -
 51
51 -
 52
52 -
 53
53 -
 54
54 -
 55
55 -
 56
56 -
 57
57 -
 58
58 -
 59
59 -
 60
60 -
 61
61 -
 62
62 -
 63
63 -
64
-
65
-
66
-
67
-
68
-
69
-
70
-
71
-
72
-
73
-
74
-
75
-
76
-
77
-
78
-
79
-
80
-
81
-
82
-
83
-
84
-
85
-
86
-
87
-
88
-
89
-
90
-
91
-
92
-
93
-
94
-
95
-
96
-
97
-
98
-
99
-
100
-
101
-
102
-
103
-
104
-
105
-
106
-
107
-
108
-
109
-
110
-
111
-
112
-
113
-
114
-
115
-
116
-
117
-
118
-
119
-
120
-
121
-
122
-
123
-
124
-
125
-
126
-
127
-
128
-
129
-
130
-
131
-
132
-
133
-
134
-
135
-
136
-
137
-
138
-
139
-
140
-
141
-
142
 |
 |
35
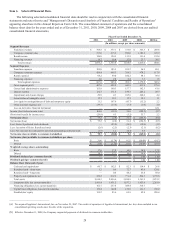
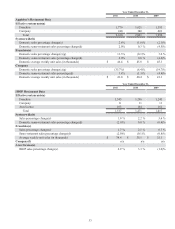
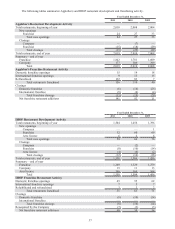
Applebee's Restaurant Data
Effective restaurants(a)
Franchise
Company
Total
System-wide(b)
Domestic sales percentage change(c)
Domestic same-restaurant sales percentage change(d)
Franchise(e)
Domestic sales percentage change(c)(g)
Domestic same-restaurant sales percentage change(d)
Domestic average weekly unit sales (in thousands)
Company
Domestic sales percentage change(c)(g)
Domestic same-restaurant sales percentage(d)
Domestic average weekly unit sales (in thousands)
Year Ended December 31,
2011
1,770
240
2,010
2.6%
2.0%
11.3%
2.0%
$ 46.4
(35.7%)
1.8%
$ 41.0
2010
1,621
380
2,001
(1.8)%
0.3 %
(0.1)%
0.6 %
$ 45.8
(8.4)%
(1.3)%
$ 40.4
2009
1,595
401
1,996
(2.1)%
(4.5)%
3.6 %
(4.4)%
$ 45.3
(19.7)%
(4.8)%
$ 41.1
IHOP Restaurant Data
Effective restaurants(a)
Franchise
Company
Area license
Total
System-wide(b)
Sales percentage change(c)
Domestic same-restaurant sales percentage change(d)
Franchise(e)
Sales percentage change(c)
Same-restaurant sales percentage change(d)
Average weekly unit sales (in thousands)
Company(f)
Area License(e)
IHOP sales percentage change(c)
Year Ended December 31,
2011
1,343
11
163
1,517
1.9 %
(2.0)%
1.7 %
(2.0)%
$ 34.4
n/a
2.9 %
2010
1,296
11
164
1,471
2.2 %
0.0 %
2.1 %
(0.1)%
$ 35.1
n/a
3.3 %
2009
1,245
11
161
1,417
5.6 %
(0.8)%
6.3 %
(0.8)%
$ 35.1
n/a
(1.6)%