IHOP 2011 Annual Report Download - page 82
Download and view the complete annual report
Please find page 82 of the 2011 IHOP annual report below. You can navigate through the pages in the report by either clicking on the pages listed below, or by using the keyword search tool below to find specific information within the annual report.-
 1
1 -
2
-
3
-
4
-
5
-
6
-
7
-
8
-
9
-
10
-
11
-
12
-
13
-
14
-
15
-
16
-
17
-
18
-
19
-
20
-
21
-
22
-
23
-
24
-
25
-
26
-
27
-
28
-
29
-
30
-
31
-
32
-
33
-
34
-
35
-
36
-
37
-
38
-
39
-
40
-
41
-
42
-
43
-
44
-
45
-
46
-
47
-
48
-
49
-
50
-
51
-
52
-
53
-
54
-
55
-
56
-
57
-
58
-
59
-
60
-
61
-
62
-
63
-
64
-
65
-
66
-
67
-
68
-
69
-
70
-
71
-
 72
72 -
 73
73 -
 74
74 -
 75
75 -
 76
76 -
 77
77 -
 78
78 -
 79
79 -
 80
80 -
 81
81 -
 82
82 -
 83
83 -
 84
84 -
 85
85 -
 86
86 -
 87
87 -
 88
88 -
 89
89 -
 90
90 -
 91
91 -
 92
92 -
93
-
94
-
95
-
96
-
97
-
98
-
99
-
100
-
101
-
102
-
103
-
104
-
105
-
106
-
107
-
108
-
109
-
110
-
111
-
112
-
113
-
114
-
115
-
116
-
117
-
118
-
119
-
120
-
121
-
122
-
123
-
124
-
125
-
126
-
127
-
128
-
129
-
130
-
131
-
132
-
133
-
134
-
135
-
136
-
137
-
138
-
139
-
140
-
141
-
142
 |
 |

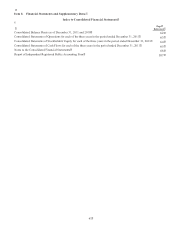
64
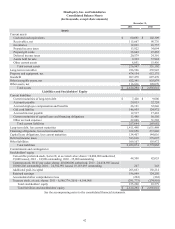
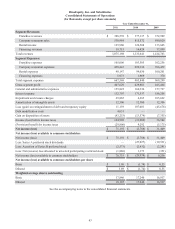
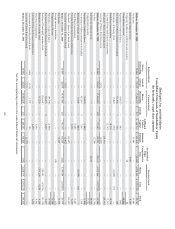
DineEquity, Inc. and Subsidiaries
Consolidated Statements of Stockholders' Equity
(In thousands, except share amounts)
Balance, December 31, 2008
Net income
Interest rate swap, net of tax
Temporary decline in available-for-sale securities
Comprehensive income
Repurchase of restricted shares
Net issuance of shares pursuant to stock plans
Reissuance of treasury stock
Stock-based compensation
Tax benefit from stock-based compensation
Dividends—Series A preferred stock
Accretion of Series B preferred stock
Balance, December 31, 2009
Net loss
Interest rate swap, net of tax
Comprehensive income
Repurchase of restricted shares
Net issuance of shares pursuant to stock plans
Reissuance of treasury stock
Stock-based compensation
Tax benefit from stock-based compensation
Dividends—Series A preferred stock
Accretion of Series B preferred stock
Balance, December 31, 2010
Net income
Foreign currency translation
Comprehensive income
Repurchase of restricted shares
Net issuance of shares pursuant to stock plans
Purchase of DineEquity common stock
Reissuance of treasury stock
Stock-based compensation
Tax benefit from stock-based compensation
Conversion of Series B preferred stock
Accretion of Series B preferred stock
Balance, December 31, 2011
Preferred Stock
Shares
Outstanding
35,000
—
—
—
—
—
—
—
—
—
—
35,000
—
—
—
—
—
—
—
—
—
35,000
—
—
—
—
—
—
—
—
(100)
—
34,900
Series B
Amount
$ 37,332
—
—
—
—
—
—
—
—
—
2,291
39,623
—
—
—
—
—
—
—
—
2,432
42,055
—
—
—
—
—
—
—
—
(120)
2,573
$ 44,508
Common Stock
Shares
Outstanding
17,466,355
—
—
—
(50,927)
133,992
15,029
—
—
—
—
17,564,449
—
—
(50,543)
653,519
15,658
—
—
—
—
18,183,083
—
—
(91,798)
366,055
(534,101)
135,230
—
—
1,737
—
18,060,206
Amount
$ 237
—
—
—
—
1
—
—
—
—
—
238
—
—
5
—
—
—
—
—
243
—
—
4
—
—
—
—
—
—
$ 247
Additional
Paid-in
Capital
$ 165,315
—
—
—
(605)
323
(769)
10,710
(3,767)
—
—
171,207
—
—
(1,884)
7,963
(849)
13,085
2,692
—
—
192,214
—
—
(5,080)
2,423
—
—
9,492
6,494
120
—
$ 205,663
Retained
Earnings
$ 145,810
31,409
—
—
—
—
—
—
—
(19,531)
(2,291)
155,397
(2,788)
—
—
—
—
—
—
(25,927)
(2,432)
124,250
75,192
—
—
—
—
—
—
—
—
(2,573)
$ 196,869
Accumulated
Other
Comprehensive
Loss
$ (29,408)
—
8,507
90
—
—
—
—
—
—
—
(20,811)
—
20,529
—
—
—
—
—
—
—
(282)
—
(12)
—
—
—
—
—
—
—
—
$ (294)
Treasury Stock
Shares
6,230,595
—
—
—
—
—
(15,029)
—
—
—
—
6,215,566
—
—
—
—
(15,658)
—
—
—
—
6,199,908
—
—
—
—
534,101
(135,230)
—
—
—
—
6,598,779
Cost
$(276,519)
—
—
—
—
—
769
—
—
—
—
(275,750)
—
—
—
—
849
—
—
—
—
(274,901)
—
—
—
—
(21,170)
4,298
—
—
—
—
$(291,773)
Total
$ 42,767
31,409
8,507
90
40,006
(605)
324
—
10,710
(3,767)
(19,531)
—
69,904
(2,788)
20,529
17,741
(1,884)
7,968
—
13,085
2,692
(25,927)
—
83,579
75,192
(12)
75,180
(5,080)
2,427
(21,170)
4,298
9,492
6,494
—
—
$ 155,220
See the accompanying notes to the consolidated financial statements.