IHOP 2011 Annual Report Download - page 73
Download and view the complete annual report
Please find page 73 of the 2011 IHOP annual report below. You can navigate through the pages in the report by either clicking on the pages listed below, or by using the keyword search tool below to find specific information within the annual report.-
 1
1 -
2
-
3
-
4
-
5
-
6
-
7
-
8
-
9
-
10
-
11
-
12
-
13
-
14
-
15
-
16
-
17
-
18
-
19
-
20
-
21
-
22
-
23
-
24
-
25
-
26
-
27
-
28
-
29
-
30
-
31
-
32
-
33
-
34
-
35
-
36
-
37
-
38
-
39
-
40
-
41
-
42
-
43
-
44
-
45
-
46
-
47
-
48
-
49
-
50
-
51
-
52
-
53
-
54
-
55
-
56
-
57
-
58
-
59
-
60
-
61
-
62
-
 63
63 -
 64
64 -
 65
65 -
 66
66 -
 67
67 -
 68
68 -
 69
69 -
 70
70 -
 71
71 -
 72
72 -
 73
73 -
 74
74 -
 75
75 -
 76
76 -
 77
77 -
 78
78 -
 79
79 -
 80
80 -
 81
81 -
 82
82 -
 83
83 -
84
-
85
-
86
-
87
-
88
-
89
-
90
-
91
-
92
-
93
-
94
-
95
-
96
-
97
-
98
-
99
-
100
-
101
-
102
-
103
-
104
-
105
-
106
-
107
-
108
-
109
-
110
-
111
-
112
-
113
-
114
-
115
-
116
-
117
-
118
-
119
-
120
-
121
-
122
-
123
-
124
-
125
-
126
-
127
-
128
-
129
-
130
-
131
-
132
-
133
-
134
-
135
-
136
-
137
-
138
-
139
-
140
-
141
-
142
 |
 |

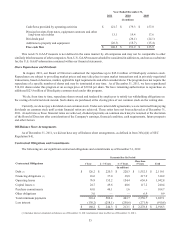
55
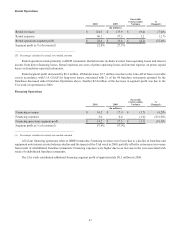
Cash flows provided by operating activities
Principal receipts from notes, equipment contracts and other
long-term receivables
Dividends paid
Additions to property and equipment
Free cash flow
Year Ended December 31,
2011
(In millions)
$ 121.7
13.1
—
(26.3)
$ 108.5
2010
$ 179.3
19.4
(26.1)
(18.7)
$ 153.9
2009
$ 157.8
17.6
(24.1)
(15.4)
$ 135.9
This non-U.S. GAAP measure is not defined in the same manner by all companies and may not be comparable to other
similarly titled measures of other companies. Non-U.S. GAAP measures should be considered in addition to, and not as a substitute
for, the U.S. GAAP information contained within our financial statements.
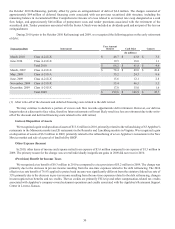
Share Repurchases and Dividends
In August, 2011, our Board of Directors authorized the repurchase up to $45.0 million of DineEquity common stock.
Repurchases are subject to prevailing market prices and may take place in open market transactions and in privately negotiated
transactions, based on business, market, applicable legal requirements and other considerations. The program does not require the
repurchase of a specific number of shares and may be terminated at any time. As of December 31, 2011, we have repurchased
534,101 shares under this program at an average price of $39.64 per share. We have remaining authorization to repurchase an
additional $23.8 million of DineEquity common stock under this program.
We do, from time to time, repurchase shares owned and tendered by employees to satisfy tax withholding obligations on
the vesting of restricted stock awards. Such shares are purchased at the closing price of our common stock on the vesting date.
Currently, we do not pay a dividend on our common stock. Under our current debt agreements, we are restricted from paying
dividends on common stock until certain financial ratios are achieved. Those ratios have not been achieved as of December 31,
2011. At such time as those financial ratios are achieved, dividend payments on common stock may be resumed at the discretion
of the Board of Directors after consideration of the Company's earnings, financial condition, cash requirements, future prospects
and other factors.
Off-Balance Sheet Arrangements
As of December 31, 2011, we did not have any off-balance sheet arrangements, as defined in Item 303(a)(4) of SEC
Regulation S-K.
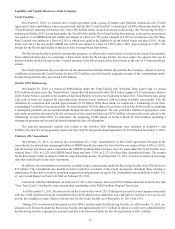
Contractual Obligations and Commitments
The following are our significant contractual obligations and commitments as of December 31, 2011:
Contractual Obligations
Debt (1)
Financing obligations (1)
Operating leases
Capital leases (1)
Purchase commitments
Other obligations
Total minimum payments
Less interest
Payments Due By Period
1 Year
(in millions)
$ 126.2
16.6
76.9
24.7
63.0
3.0
310.4
(130.2)
$ 180.2
2 - 3 Years
$ 220.3
37.0
155.2
49.8
40.1
—
502.4
(258.1)
$ 244.3
4 - 5 Years
$ 220.3
38.8
154.4
48.6
1.6
—
463.7
(250.6)
$ 213.1
More than
5 Years
$ 1,552.3
217.9
656.4
117.2
—
6.9
2,550.7
(271.9)
$ 2,278.8
Total
$ 2,119.1
310.2
1,042.8
240.4
104.7
9.9
3,827.1
(910.8)
$ 2,916.3
(1) Includes interest calculated on balances as of December 31, 2011 and interest rates in effect as of December 31, 2011.